

Marketing Mix Modeling for Meta Ads: Beyond Last-Click Attribution
Prepare aligned weekly data for MMM, inspect identification and calibration, and turn uncertain model scenarios into a contribution-based budget memo.

Marketing mix modeling can inform a cross-channel budget question using aggregated time series. It estimates channel contributions conditional on the data, model and identification assumptions. A last-click assignment and an MMM estimate answer different questions; neither automatically establishes the true number of additional sales.
Start with the business outcome and a common clock
Define net booked sales in USD after refunds, one business timezone, and Monday–Sunday weeks. Sum daily spend and revenue into those same weeks, sum impressions, and record a promotion flag or a documented intensity measure. Do not sum daily reach as weekly unique reach or average daily ratios as weekly ROAS. Missing data stays missing until reconciled; it is not a zero-spend observation.
| Weekly input | Definition and acceptance |
|---|---|
| Net sales USD | Finance-ledger value, refund policy, tax inclusion and geography fixed |
| Meta / search spend USD | Actual delivered spend; currency and week boundaries reconciled |
| Meta / search impressions | Same exposure window; explain exclusions and collection gaps |
| Promotion / price / stock | Documented independent business factors with timing |
| Trend / seasonality / other channels | Pre-specified candidate controls; avoid unmeasured omissions masquerading as baseline |
The Robyn analyst guide explains input review, model design, adstock and saturation. Its history/window recommendations are planning guidance, not proof of identification. Google’s primary Meridian repository describes aggregate national/geo models and experimental calibration. Both require analyst decisions; software access is not validation.
A transparent weekly teaching model
Hypothetical arithmetic only, not a fitted Robyn or Meridian model: A_M,t = 0.5 × A_M,t−1 + MetaSpend_t, with A_M,0 = 0; define search adstock identically. Let g(A) = A / (1,000 + A). Assume weekly sales y_t = 10,000 + 3,000 × g(A_M,t) + 2,000 × g(A_S,t) + 500 × Promo_t. USD 1,000 saturation scale, coefficients and 0.5 carryover are chosen teaching assumptions, not estimates for Meta.
| Week starting / all inputs hypothetical | Meta spend / search spend USD | Promo | Meta / search adstock | Calculated sales USD |
|---|---|---|---|---|
| October 5, 2026 | 1,000 / 500 | 0 | 1,000 / 500 | 12,166.67 |
| October 12, 2026 | 1,000 / 500 | 1 | 1,500 / 750 | 13,157.14 |
| October 19, 2026 | 500 / 1,000 | 0 | 1,250 / 1,375 | 12,824.56 |
| October 26, 2026 | 0 / 500 | 0 | 625 / 1,187.5 | 12,239.56 |
For week one, 10,000 + 3,000 × 1,000 / 2,000 + 2,000 × 500 / 1,500 = USD 12,166.67. Four invented rows demonstrate aligned inputs and transformations, not enough evidence to estimate these parameters. A production dataset needs adequate variation, coverage and outcome quality relative to its proposed complexity; two years of repeated synchronized channel changes can still fail to separate effects.
Stop wasting ad budget
NovaStorm AI cuts Meta Ads CPA by 30% on average. No complex setup required.
Identify what the data cannot distinguish
- Draw the causal assumptions before selecting controls. Promotions can affect both spend and sales; a downstream click or search behavior caused by Meta is not automatically an appropriate confounder control.
- Inspect channel co-movement, stockouts and structural breaks. Two weeks of spend variation do not guarantee sufficient independent information, statistical power or full carryover observation.
- Compare plausible model structures and windows, parameter uncertainty and prior sensitivity. Similar predictive fit can coexist with different channel decompositions.
- Use time-ordered held-out prediction and residual diagnostics; prediction alone does not validate causality.
- Calibrate with an eligible randomized or geo experiment using its measured outcome, geography, period and uncertainty. Do not import a point estimate from a different population as exact truth.
No universal 7–14 day adstock is assumed. Avoid extrapolating a response curve far beyond observed spend or into a new market. See the geo-lift experiment guide when planning an external calibration.
Translate marginal revenue into marginal contribution
In the hypothetical equation, at Meta adstock A = USD 1,000, the same-week derivative is 3,000 × 1,000 / (1,000 + 1,000)^2 = USD 0.75 revenue per additional USD of spend with search and promotion fixed. It is not an observed ROI and does not include future carryover. At assumed 40% contribution margin, that becomes USD 0.30 contribution before the extra media dollar and production: insufficient under those assumptions.
A separate hypothetical budget memo assumes USD 200 extra media, USD 40 incremental production and modeled incremental revenue scenarios of USD 400 / 600 / 800. At 40% margin, net incremental contribution is respectively −USD 80 / USD 0 / USD 80. These are chosen sensitivity scenarios, not a posterior interval. Do not shift budget merely because Meta receives more attributed credit; accept the uncertainty and maximum cash risk explicitly.
A reviewable handoff to NovaStorm
Attach the external analyst’s model version, dataset cutoff, controls, calibration report, scenario range and margin definition to a campaign brief. If approved, prepare a paused draft for the bounded change, verify currency/budget type and keep the old plan for rollback. Assign an owner, review date and maturity condition before any live action. This is a way to use an external model’s conclusion; it does not claim that NovaStorm fits MMM, measures causal lift or reallocates spend automatically.
Published by NovaStorm AI. Hypothetical examples are labeled in the text; they are not observed customer results.
Disclaimer: This article was generated with the assistance of AI and reviewed by the NovaStorm AI team. While we strive for accuracy, we recommend verifying specific data points and consulting official sources (linked where available) for critical business decisions.
Ready to automate your Meta Ads?
NovaStorm AI takes full responsibility for your campaigns — from monitoring to optimization.
Start NowMore on Attribution and incrementality
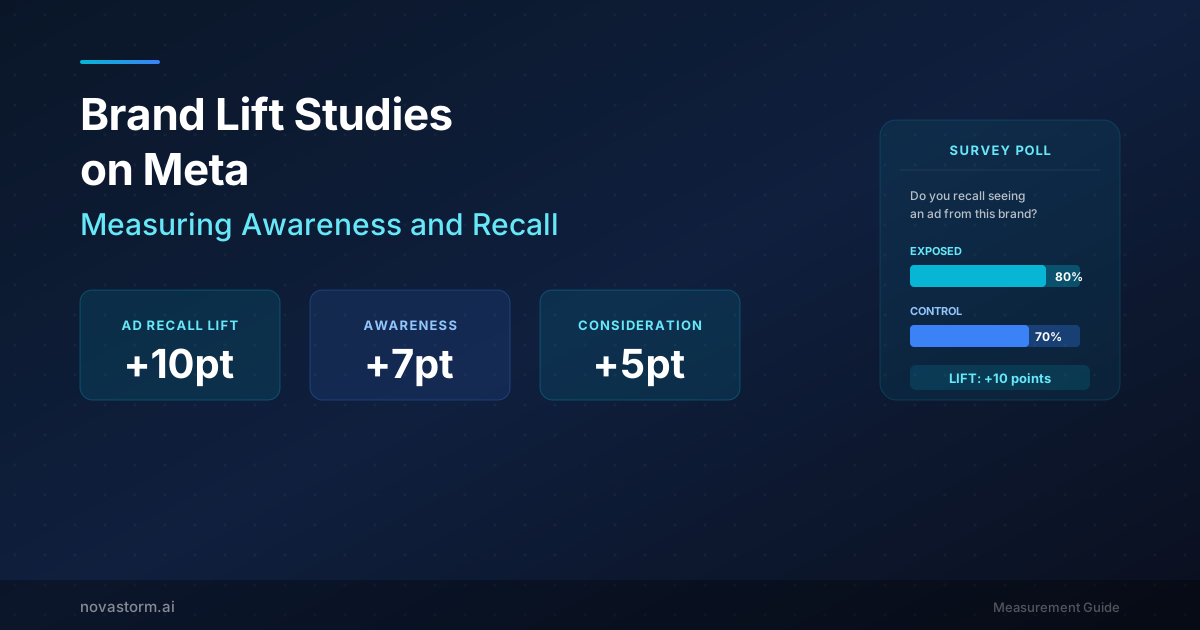
Brand Lift Studies on Meta: Measuring Awareness and Recall
Plan a brand-lift survey with account eligibility, neutral questions, response denominators and properly interpreted uncertainty.
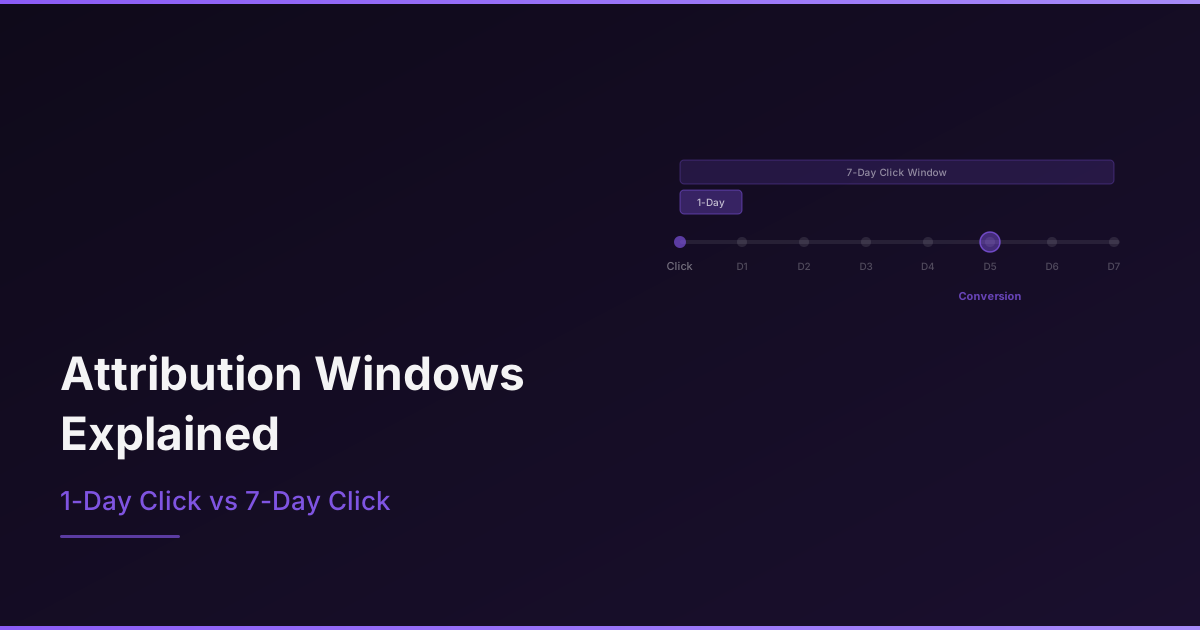
Attribution Windows Explained: 1-Day Click vs 7-Day Click
Compare attribution windows using the same spend and mature orders while separating reporting credit, delivery settings and incremental lift.
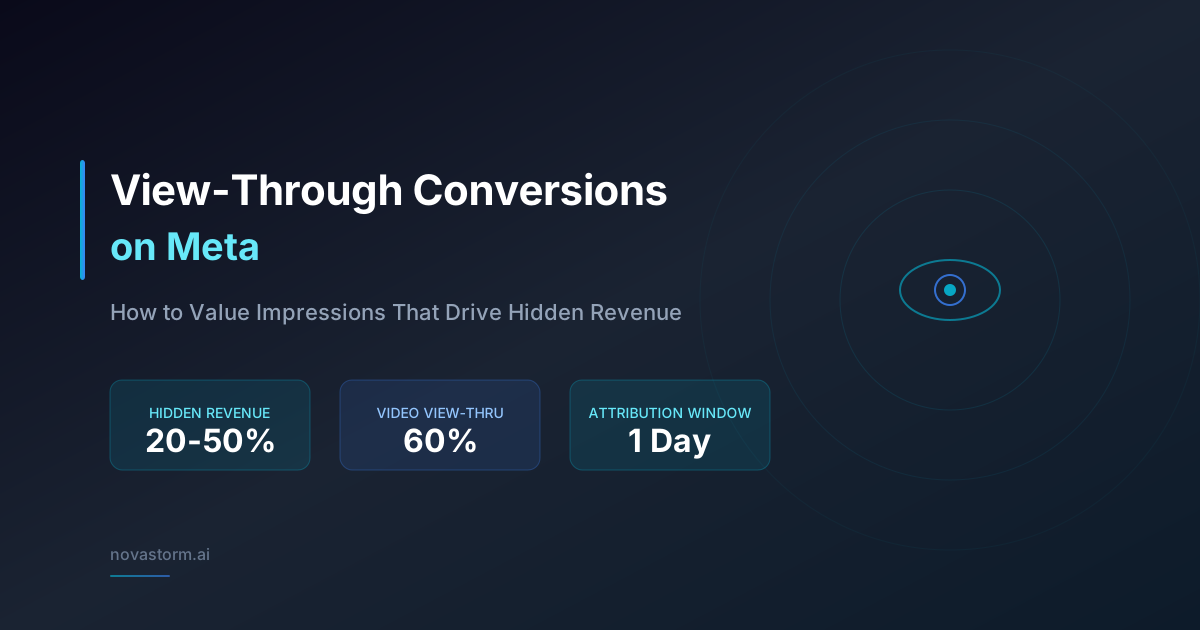
View-Through Conversions on Meta: How to Value Impressions
Compare view-through credit with click-only reports while keeping causal lift and mature contribution separate.
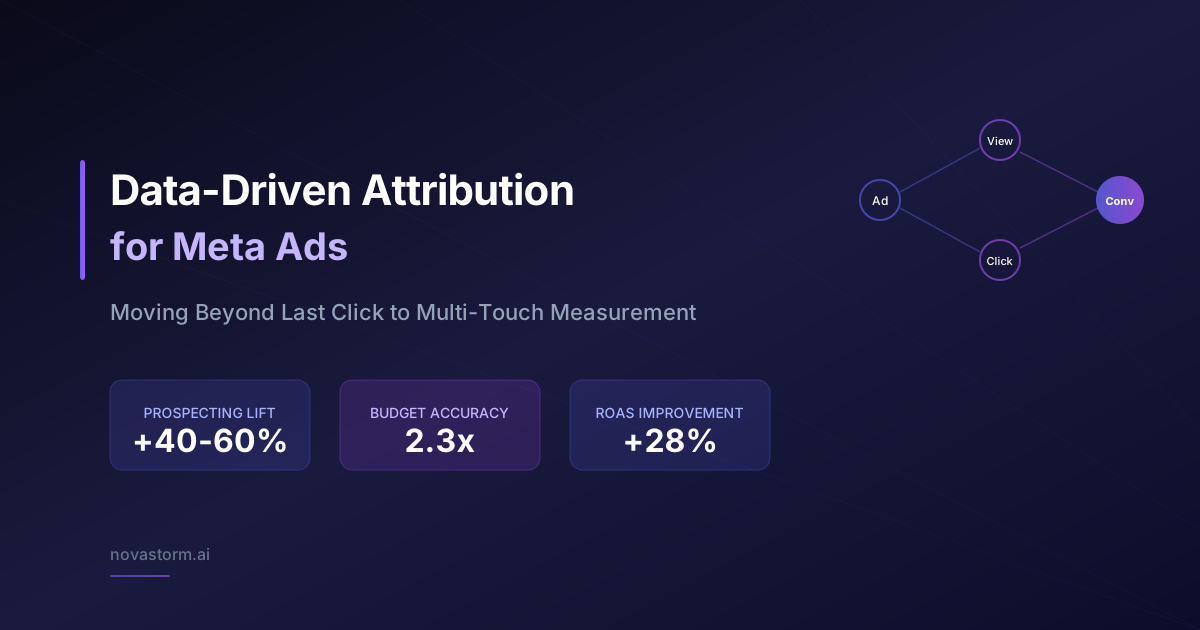
Data-Driven Attribution for Meta Ads: Moving Beyond Last Click
Compare attribution models with a reproducible credit worksheet, then use mature economics and incremental evidence for budget decisions.