

Geo-Lift Testing on Meta: Measuring True Campaign Impact
Design a geo-lift test with GeoLift tutorial data, pre-period checks, power planning and margin-based decisions that account for uncertainty.
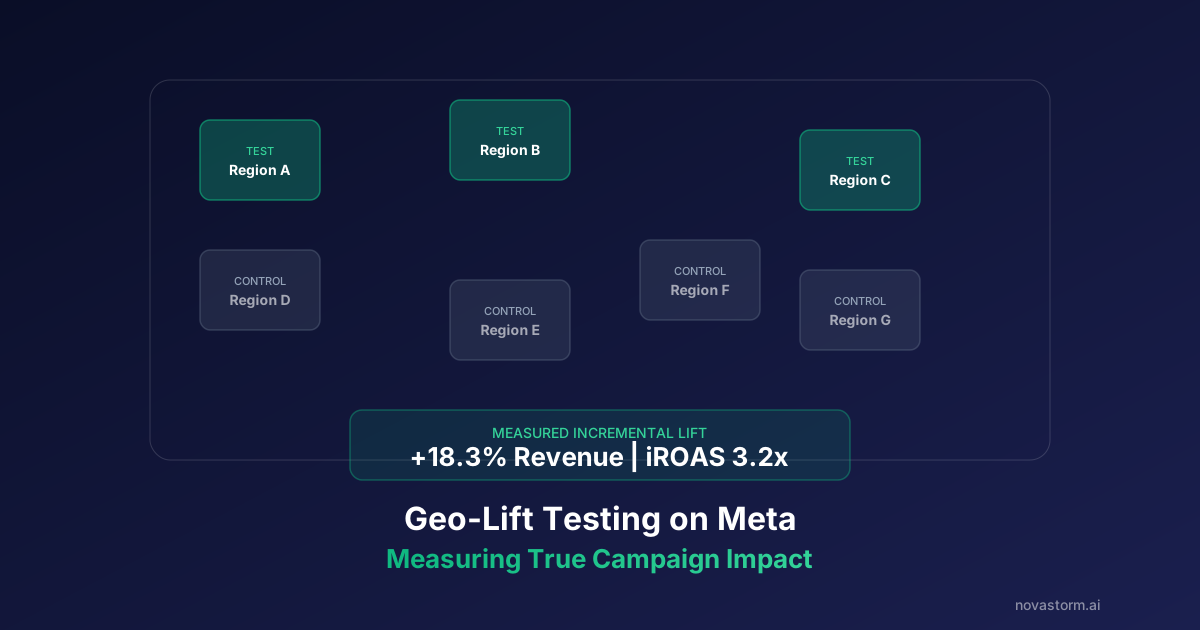
A geo-lift test asks whether changing advertising in selected regions changes business outcomes relative to a defensible counterfactual. Define the intervention, outcome and financial decision before selecting markets. Geographic separation helps create a comparison, but travel, regional events and changes in other marketing can still compromise it.
Choose the comparison before seeing the result
A paired design matches a treated market with a comparable control market and evaluates their outcome difference under a prespecified design. A synthetic control instead builds a weighted combination of donor markets to approximate the treated market before intervention. These are different methods: a good pair is not automatically the same as a fitted synthetic control.
- Use stable geography definitions and an outcome recorded consistently across regions, preferably retained revenue or contribution from the business system.
- Inspect missing dates, pre-test trends, residual patterns and stockouts. Examine historical placebo periods and hold back part of the pre-period to check predictive stability.
- Select eligible donor markets using pre-treatment data and operational constraints. Exclude markets with likely spillover or their own conflicting intervention.
- Keep assignment and the donor-selection procedure fixed before reading post-treatment performance. Choosing the best-looking control afterward biases the result.
A reproducible educational GeoLift analysis
The official GeoLift repository describes installation and requirements. Its walkthrough supplies simulated data with 40 cities, 90 pre-test days and a test dataset extending through day 105. After installing its documented dependencies, the following R workflow uses those supplied datasets; it is a tutorial exercise, not a NovaStorm customer experiment.
library(GeoLift)
data(GeoLift_PreTest)
pre_panel <- GeoDataRead(GeoLift_PreTest, date_id="date", location_id="location", Y_id="Y", X=c(), format="yyyy-mm-dd")
GeoPlot(pre_panel, Y_id="Y", time_id="time", location_id="location")
data(GeoLift_Test)
test_panel <- GeoDataRead(GeoLift_Test, date_id="date", location_id="location", Y_id="Y", X=c(), format="yyyy-mm-dd")
example_fit <- GeoLift(data=test_panel, Y_id="Y", locations=c("chicago", "portland"), treatment_start_time=91, treatment_end_time=105)
summary(example_fit)
Read the pre-period plot before interpreting the summary. Inspect the treatment effect, uncertainty and diagnostics in the fitted object, and compare them with the counterfactual assumptions. The dates and locations above reproduce the tutorial setup; they are not recommendations for your market. GeoDataRead expects complete time series, so check its warnings against the input rather than silently accepting dropped observations.
Stop wasting ad budget
NovaStorm AI cuts Meta Ads CPA by 30% on average. No complex setup required.
Select duration from power and conversion delay
Use historical variability, an economically meaningful minimum effect, eligible markets and feasible spend to simulate candidate designs. GeoLift’s documented market-selection and power workflow supports that planning. A four-week or eight-week test is not inherently adequate: extra duration can add signal, but it can also expose the test to changing conditions.
- Prespecify treatment dates, spend intervention, outcome window and reporting delay. Include the business conversion lag and refund maturation, not just the platform attribution setting.
- Record regional promotions, weather, local events, stock availability and travel between regions. Decide in advance what invalidates a market or the entire test.
- Check that actual delivery creates the intended difference in advertising. Analyze the assigned intervention and report deviations rather than selecting only successful markets.
- Avoid changing controls, outcome definitions or stopping rules because an interim result looks favorable.
Use margin and uncertainty to decide whether to scale
Incremental ROAS is incremental revenue divided by incremental media spend. At a hypothetical 40% contribution margin, iROAS 1.1 on $10,000 of media yields $11,000 × 0.40 − $10,000 = −$5,600 before other test costs. Media-only break-even iROAS is 1 / 0.40 = 2.5; adding $1,000 of execution cost raises it to $11,000 / ($10,000 × 0.40) = 2.75.
For a separate hypothetical decision worksheet, assume an iROAS estimate of 3.2 and an uncertainty interval of 2.0–4.2, with $10,000 media and $1,000 execution cost. Net contribution is $1,800 at the point estimate and ranges from −$3,000 to $5,800. This interval is assumed for teaching, not computed from the tutorial or claimed as observed evidence. A positive point estimate with a materially negative lower range warrants another bounded decision, not automatic scaling.
After a valid test supports a Meta campaign decision, translate the approved geography, offer and budget into a NovaStorm campaign draft and review its saved fields before publication. Conduct the geographic experiment and GeoLift analysis in the separate measurement workflow.
Published by NovaStorm AI. Worked examples and proposed tests are labeled in the article.
Disclaimer: This article was generated with the assistance of AI and reviewed by the NovaStorm AI team. While we strive for accuracy, we recommend verifying specific data points and consulting official sources (linked where available) for critical business decisions.
Ready to automate your Meta Ads?
NovaStorm AI takes full responsibility for your campaigns — from monitoring to optimization.
Start NowMore on Attribution and incrementality
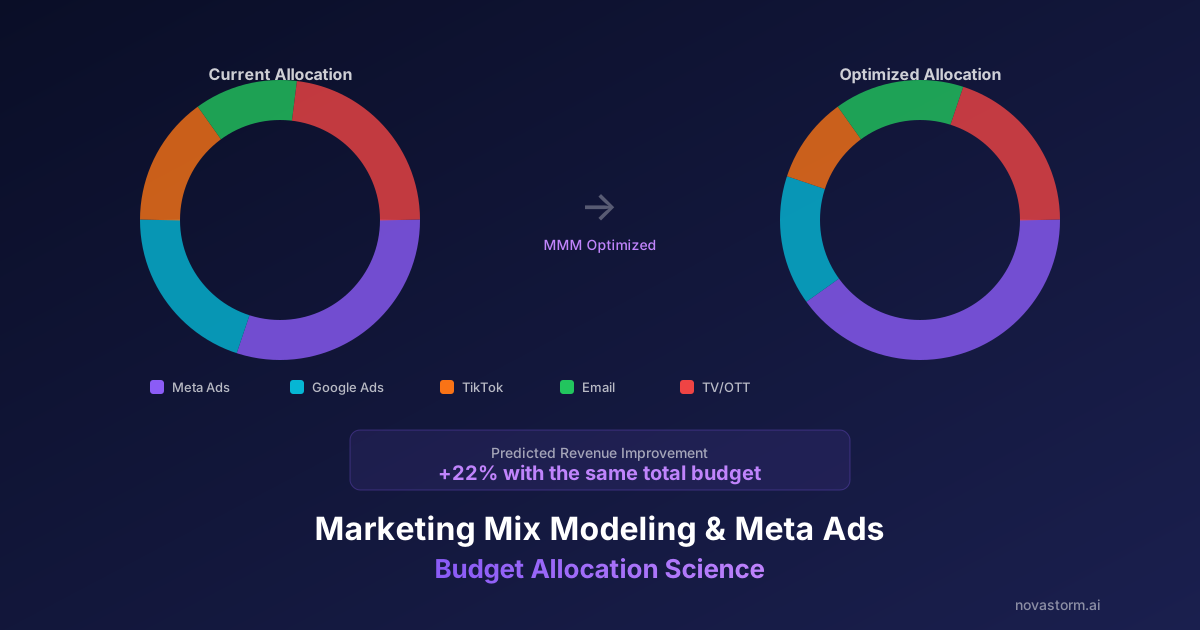
Marketing Mix Modeling and Meta Ads: Budget Allocation Science
Build a defensible MMM budget scenario: inspect channel identification, seasonality, held-out predictions, uncertainty and contribution margin.

Blended ROAS: Why You Should Stop Optimizing Per-Channel
Reconcile blended ROAS denominators, refunds and contribution margin, and separate cross-channel reporting from evidence of incremental lift.
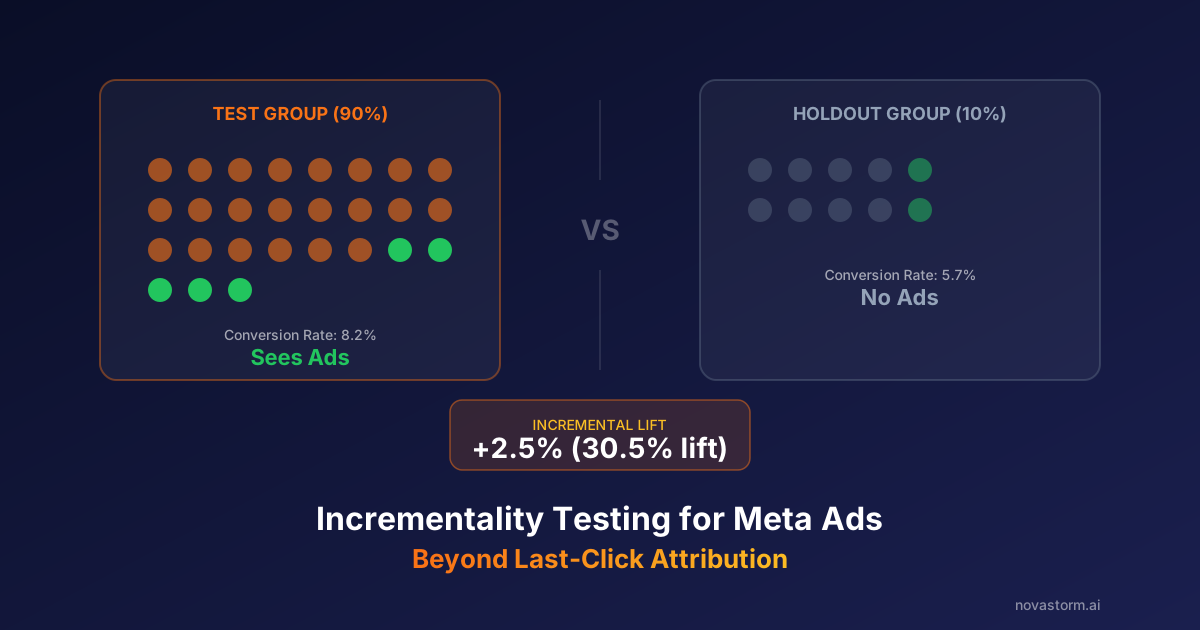
Incrementality Testing for Meta Ads: Beyond Last-Click Attribution
Design an incrementality test with a defined holdout, group-based sample assumptions, effect intervals and contribution economics.
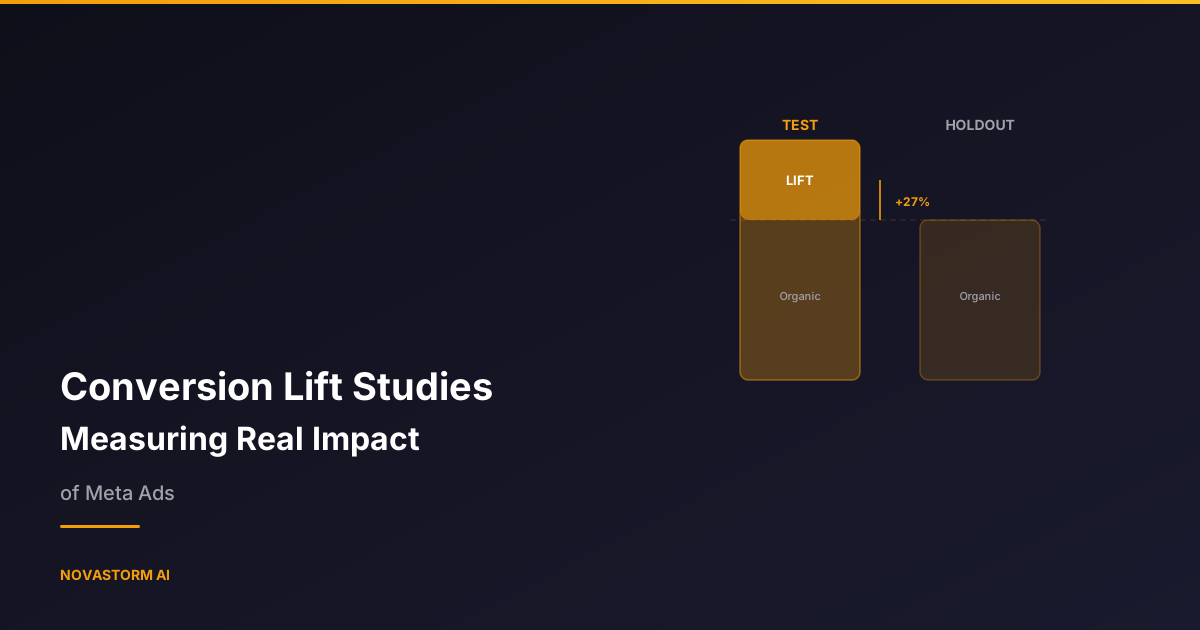
Conversion Lift Studies: Measuring Real Impact of Meta Ads
Normalize unequal holdout groups, calculate incremental conversions and revenue, and interpret uncertain lift before changing the budget.