

Customer Lifetime Value: How LTV Changes Your Meta Ads Strategy
Separate revenue and contribution LTV, compare equal-age cohorts, validate forecasts and set acquisition limits around cash and payback.
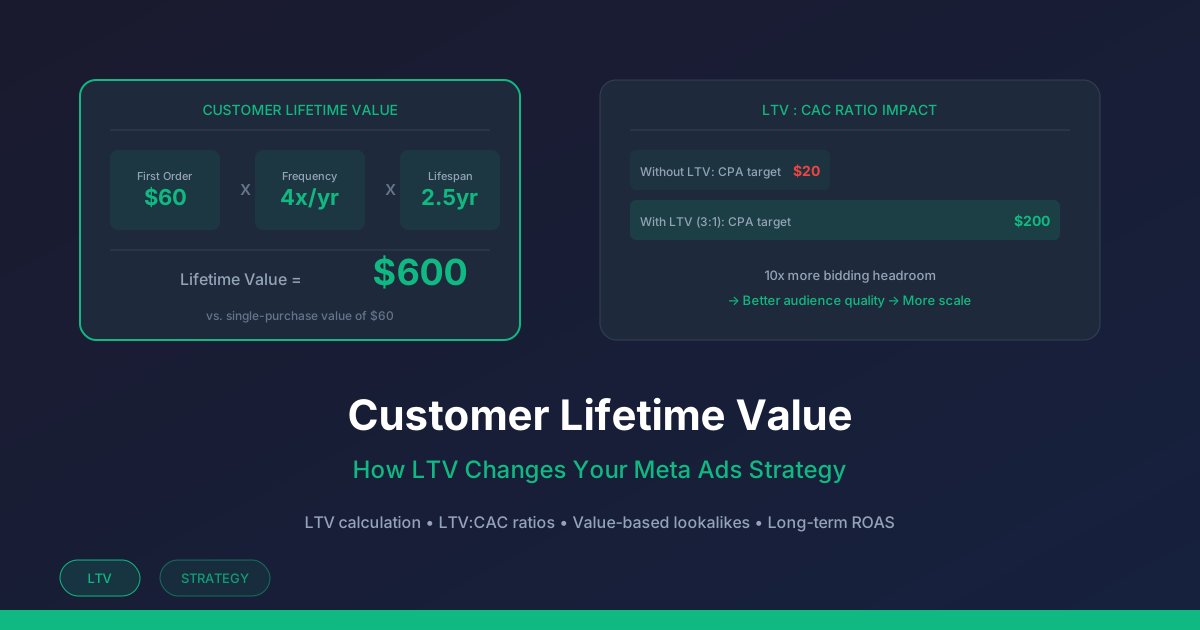
Customer lifetime value needs a definition and a time horizon. Cumulative revenue describes sales; contribution after variable costs describes resources available for acquisition and overhead. Keep observed repeat purchases separate from projected purchases, and record when the money is received.
Keep the three values separate
Illustrative assumptions: $60 revenue per order × four purchases per year × a 2.5-year relationship gives $600 revenue LTV. A forecast of $240 contribution after product, delivery, payment, refund and retention costs, less a $40 reserve for overhead/profit, leaves a $200 acquisition allowance. None of these future purchases is guaranteed.
| Definition | Illustrative value | Meaning |
|---|---|---|
| Revenue LTV | $600 over 2.5 assumed years | Sales before costs, not acquisition capacity |
| Contribution LTV | $240 over that horizon | After the declared variable and retention costs |
| Required reserve | $40 | Protected overhead/profit contribution |
| Lifetime acquisition allowance | $200 | Forecast ceiling before cash and payback constraints |
If the $240 forecast did not yet include refunds and a scenario adds $30 of refund-related contribution loss, revised contribution is $210 and the allowance is $170. Do not subtract the same refund twice. A refunded payment, recovered inventory and return shipping have different cash/cost effects; reconcile them in the actual model.
Compare cohorts at the same age
Synthetic training table, not customer data: both cohorts are evaluated through day 90 after first purchase. "Observed" below means assumed completed transactions in this fictional example, not a real NovaStorm measurement. Future columns remain forecasts.
| Cohort | New customers | Repeat orders through day 90 | Observed net revenue / contribution through day 90 | Forecast later contribution per acquired customer |
|---|---|---|---|---|
| A | 100 | 40 | $8,000 / $3,000 | $180 through the remaining 2.5-year horizon |
| B | 100 | 20 | $7,000 / $2,700 | $150 through the remaining 2.5-year horizon |
Stop wasting ad budget
NovaStorm AI cuts Meta Ads CPA by 30% on average. No complex setup required.
Repeat orders are not the same as distinct repeating customers. Divide cohort contribution by all acquired customers, including those with no repeat order: A has $30 and B has $27 per customer through day 90. The table does not establish channel causality or validate its future forecast. Record unique repeat customers separately when measuring retention.
Shopify’s customer cohort documentation groups first orders and reports subsequent intervals; its projections are estimates rather than guaranteed sales. Add your own costs before interpreting a revenue report as contribution.
Validate the forecast as cohorts mature
- Freeze the forecast version, cohort definition, horizon and assumptions before observing later purchases.
- At day 90, 180 and each declared checkpoint, compare cumulative net revenue, refunds and contribution with the prediction made at the same earlier age. Use the same cost definitions and all acquired customers.
- Backtest on earlier cohorts without using their later outcomes to fit the forecast being evaluated. Report error and a conservative downside scenario.
- Revise assumptions for genuine changes in retention, prices or costs. Preserve the old forecast and explain the difference instead of rewriting history.
Cash can impose a lower acquisition limit
If the first order contributes $24 and acquisition costs $200 today, the initial contribution deficit is $176 per customer before repeats. For 100 customers that is $17,600; future LTV cannot pay today’s bills. Map actual collection, supplier payments, refunds and repeat receipts by month. Apply the lower of the lifetime allowance, the affordable cash limit and the approved payback limit. First-order contribution alone is not a full cash-flow statement.
The user must confirm actual margin, acquisition costs, usable cash and payback assumptions before they inform a NovaStorm campaign brief or paused campaign and local ad-set drafts. Automated LTV calculation or customer-data integration is not assumed. See the CAC and payback guide.
Published by NovaStorm AI. Planning examples are illustrative assumptions, not measured customer results.
Disclaimer: This article was generated with the assistance of AI and reviewed by the NovaStorm AI team. While we strive for accuracy, we recommend verifying specific data points and consulting official sources (linked where available) for critical business decisions.
Ready to automate your Meta Ads?
NovaStorm AI takes full responsibility for your campaigns — from monitoring to optimization.
Start NowMore on Budget and unit economics
Cost Per Result: Understanding Your True Acquisition Cost
Distinguish media cost per reported result from full new-customer CAC, allocate acquisition costs once and set a commercial media ceiling.
Meta Purchase-Value Optimization: Revenue, Refunds and Margin
Evaluate purchase-value optimization with an event-quality worksheet, refund-adjusted contribution and a separate mature-outcome comparison.
ROAS: The Complete Guide to Return on Ad Spend
Calculate ROAS and contribution after returns, reconcile duplicate channel credit and record comparable report scope before changing budget.
How to Calculate Your Break-Even ROAS for Meta Ads
Calculate a contribution-based CPA ceiling and ROAS target, then stress-test refunds, delivery, new-customer mix and mature campaign costs.