

How to Calculate Your Break-Even ROAS for Meta Ads
Calculate a contribution-based CPA ceiling and ROAS target, then stress-test refunds, delivery, new-customer mix and mature campaign costs.
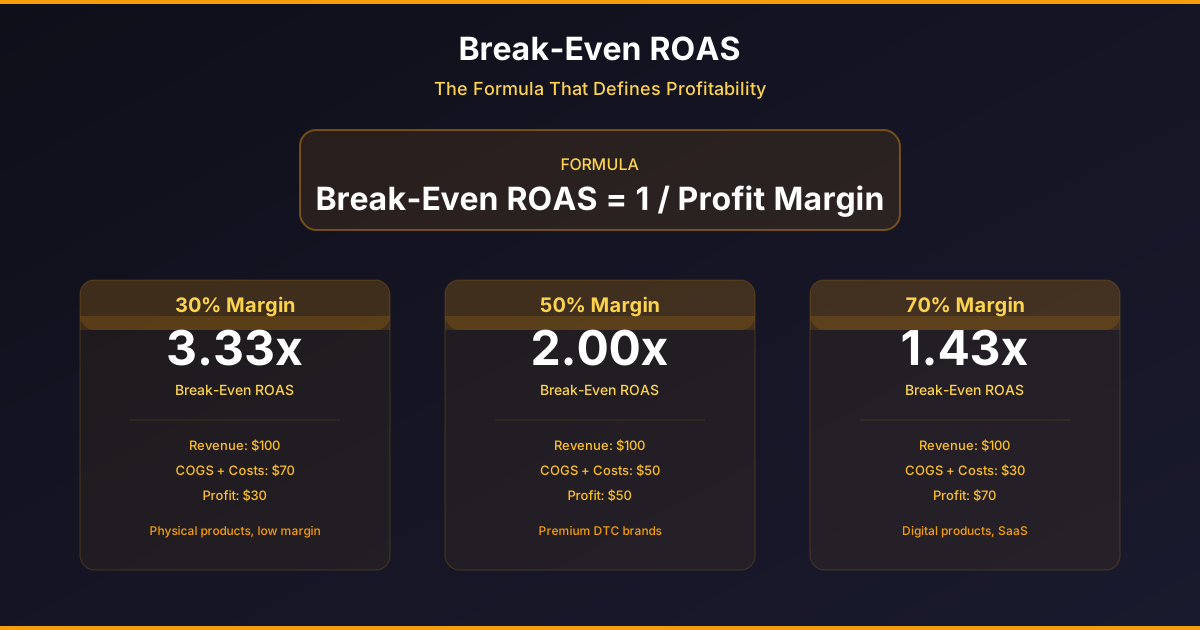
Break-even ROAS depends on your retained revenue and costs. A platform target cannot supply missing margin. The filled worksheet below uses hypothetical dollar amounts so you can reproduce the arithmetic; replace every amount with your own finance records before changing a budget.
Collect these actual inputs
| Input | Illustrative amount per order | Where to collect your amount |
|---|---|---|
| Revenue excluding sales tax | 100 | Settled order lines and tax records |
| Product cost | 35 | Supplier or inventory cost records |
| Shipping subsidy | 8 | Carrier bills minus delivery charges retained |
| Fulfillment | 4 | Pick, pack and packaging records |
| Payment fees | 3 | Processor settlement statements |
| Expected net refund loss | 10 | Mature refunds, recoverable inventory and nonrecoverable costs |
Keep the definitions consistent: the $100 is before the $10 net return-loss allowance. If your revenue is already net of refunds, do not subtract the same refund twice. Net return loss should account for recovered inventory and costs already included elsewhere. Use a mature cohort and one currency.
Contribution before advertising = $100 − $35 − $8 − $4 − $3 − $10 = $40. With no overhead or profit reserve included, the maximum media CPA is $40 and break-even ROAS is $100 ÷ $40 = 2.5. This is contribution break-even, not company net profit.
| Media CPA | Reported gross-revenue ROAS | Contribution after media |
|---|---|---|
| 25 | 4.0 | 15 |
| 40 | 2.5 | 0 |
| 50 | 2.0 | −10 |
From break-even to a target of 5.0
Suppose monthly fixed overhead is $2,000 and the planning volume is 200 orders. The allocation is $10 per order. Reserve another $10 per order for profit. Allowed media CPA becomes $40 − $10 − $10 = $20, and the corresponding gross-revenue ROAS target is $100 ÷ $20 = 5.0. Volume changes alter the overhead allocation; verify it again rather than treating 5.0 as a permanent industry rule.
| Sensitivity scenario | Contribution before media | Allowed CPA after $20 overhead/profit allocation | Gross-revenue ROAS target |
|---|---|---|---|
| Baseline | 40 | 20 | 5.0 |
| Additional net return loss: $10 | 30 | 10 | 10.0 |
| Additional shipping cost: $4 | 36 | 16 | 6.25 |
| Both changes | 26 | 6 | 16.67, rounded |
Stop wasting ad budget
NovaStorm AI cuts Meta Ads CPA by 30% on average. No complex setup required.
These are scenario calculations, not forecasts. If the allowed CPA is zero, there is no positive paid-acquisition allowance under this model. If it is negative, increasing ROAS does not repair the offer at the planned costs and reserves. Reprice, improve contribution, change the cost structure or revise an explicit reserve; do not launch against a negative ceiling.
Check who the orders belong to
A blended purchase CPA does not identify new-customer acquisition cost. In an illustrative campaign with $1,000 media spend and 100 retained orders, blended CPA is $10. If 70 customers are new, assigning the whole campaign spend to acquisition gives $14.29 per new customer; if only 40 are new, it gives $25. Record this allocation assumption. Mixed acquisition and retention campaigns need a defensible spend allocation before comparing new-customer CAC with first-order contribution.
A later repeat purchase can increase mature customer contribution, but future revenue cannot pay today’s bill. For example, $40 first-order contribution plus an assumed $20 within six months gives $60 before acquisition; reserving $10 permits a theoretical $50 acquisition cost and creates a $10 first-order cash gap. This is a hypothesis until retained repeat contribution and timing are measured.
A proposed 14-day review
- Choose a 14-day acquisition interval, currency, customer definition and revenue basis. Export actual delivered media spend and reconcile it with the account’s spend records; distinguish delivery spend from taxes or billing adjustments.
- Join orders through stable identifiers. Separate new and returning customers, cancellations, refunds and duplicate event receipts. Include production or other acquisition costs in a separate total-cost view.
- Wait for your actual purchase and refund delays. Fourteen days defines the acquisition interval, not guaranteed maturity; mark unresolved orders and revisit them after the required observation period.
- Replace estimated costs with settled shipping, fees, refund losses and overhead allocation. Recalculate the ceiling and sensitivity table, then compare mature outcomes against it.
- Write the decision and owner: maintain, limit exposure, retest the offer or stop. A synthetic worksheet row demonstrates a calculation; it does not prove a NovaStorm campaign is profitable.
NovaStorm can be used to prepare proposed campaign material for human review; financial acceptance requires your verified costs and campaign records. Start with the monthly ad-spend calculator and keep the contribution ceiling separate from the ROAS reporting metric.
Published by NovaStorm AI. Planning examples are illustrative assumptions, not measured customer results.
Disclaimer: This article was generated with the assistance of AI and reviewed by the NovaStorm AI team. While we strive for accuracy, we recommend verifying specific data points and consulting official sources (linked where available) for critical business decisions.
Ready to automate your Meta Ads?
NovaStorm AI takes full responsibility for your campaigns — from monitoring to optimization.
Start NowMore on Budget and unit economics
Meta Purchase-Value Optimization: Revenue, Refunds and Margin
Evaluate purchase-value optimization with an event-quality worksheet, refund-adjusted contribution and a separate mature-outcome comparison.
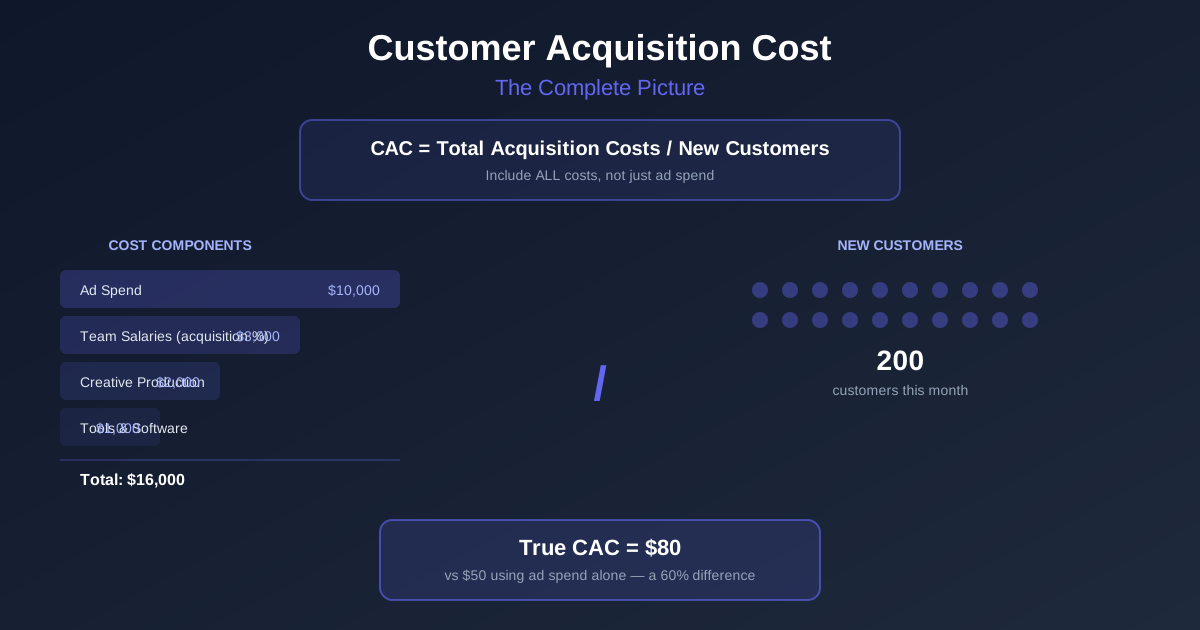
Customer Acquisition Cost: The Complete Guide to CAC for Advertisers
Reconcile full acquisition costs and unique new customers, model contribution payback with churn and apply a cash-constrained campaign ceiling.
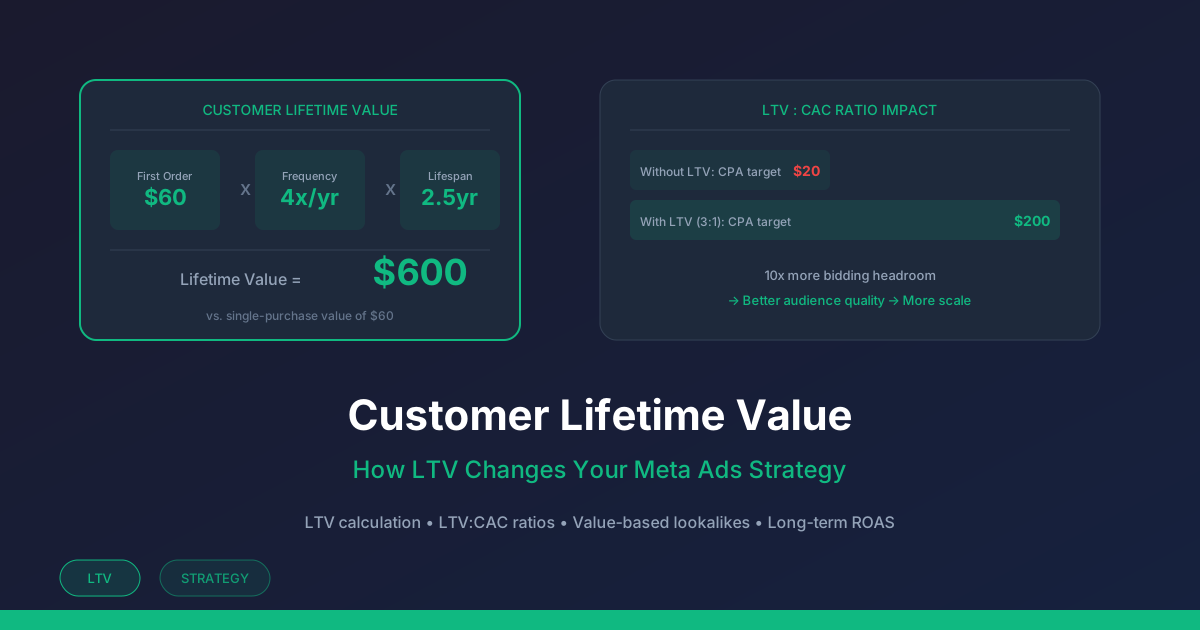
Customer Lifetime Value: How LTV Changes Your Meta Ads Strategy
Separate revenue and contribution LTV, compare equal-age cohorts, validate forecasts and set acquisition limits around cash and payback.

Meta Ads Budget Pacing: Managing Delivery Within a Spending Plan
Control cumulative Meta spend against a saved allowance, account for reporting and pause delays, and investigate underspend without forcing delivery.