

The Pirate Metrics Framework (AARRR) for Meta Ads Optimization
Use AARRR to define acquisition, activation, retention, referral and revenue measures, then prioritize evidence-backed constraints rather than the smallest rate.
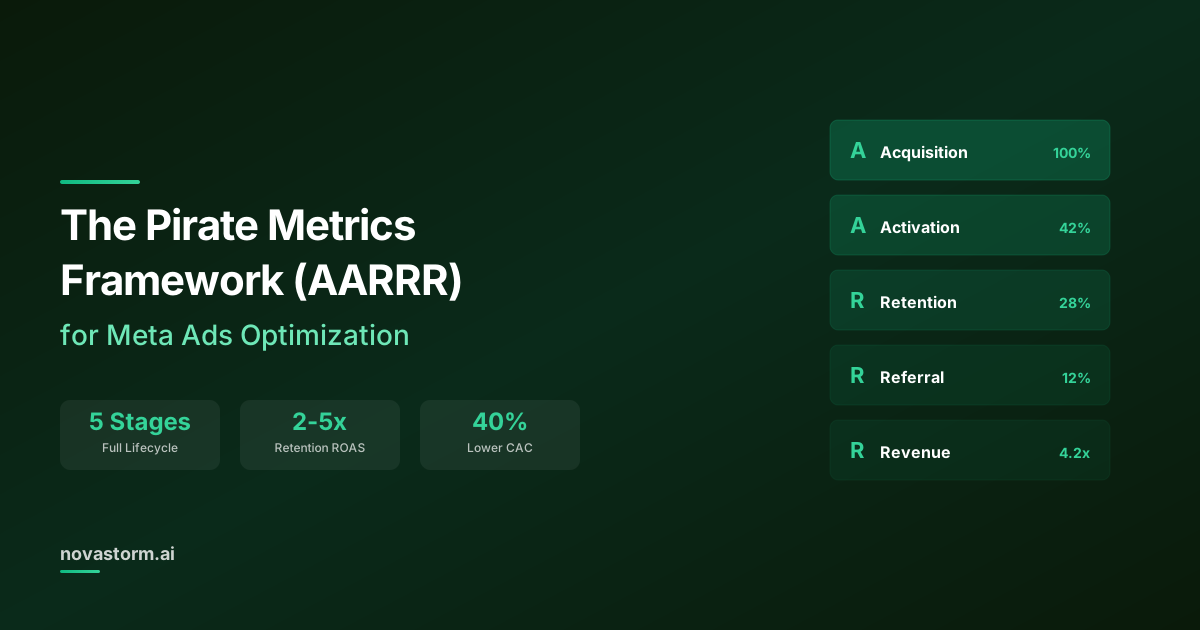
AARRR organizes growth questions into acquisition, activation, retention, referral and revenue. Use it as an analytical checklist. Customers do not have to traverse those categories in order, and the framework does not map each category automatically to a separate Meta campaign objective.
| Question | Example measure | Definition to settle |
|---|---|---|
| Acquisition | New eligible customers | Cost scope and acquisition source |
| Activation | Customers completing a useful action | What demonstrates received value? |
| Retention | Return at a stated horizon | Same follow-up age and eligible cohort |
| Referral | Verified new customers referred | Distinct referrer and referred identity |
| Revenue | Net revenue and contribution | Refunds, variable costs and period |
Define activation before optimizing it
A cart addition, thirty-second visit and signup may be diagnostic events; none automatically establishes product value. Use the business-outcome and optimization-signal distinction to evaluate a timely candidate event against the later outcome. More specific naming alone does not make a weak proxy reliable.
Worked constraint review
Illustrative cohort: 1,000 new visitors produce 100 signups, 40 useful activations and 20 retained users at the selected follow-up age. Ten customers make a verified referral, and four new customers buy. These counts require defined relationships; they cannot all be divided successively as if referral must precede revenue.
Suppose activation is 40/100 = 40% while a referral rate is 10/100 = 10%. The smaller percentage is not automatically the first problem to fix. Estimate eligible volume, customer value, evidence of friction and change effort. A confirmed broken onboarding step may deserve priority despite its larger percentage.
| Synthetic source records | Count | Denominator interpretation |
|---|---|---|
| Signup IDs S001–S040 complete useful action | 40 | 40/100 eligible signup IDs =40% activation |
| S041–S100 do not complete it by chosen age | 60 | Remain in activation denominator |
| Referrer IDs S001–S006 and S051–S054 make valid referral | 10 | 10/100 signups =10% referral; not 10/40 by default |
| Unique eligible referred buyers R001–R004 pay | 4 | Separate new-customer outcome, not required predecessor to source revenue |
These ranges are a compact synthetic ledger, not anonymized real accounts. Some valid referrers are not classified as activated; this demonstrates why AARRR questions are not a compulsory ordered path. Store actual relationships and definitions in your private ledger, and keep immature or unknown outcomes visible.
Measure retention and money consistently
Stop wasting ad budget
NovaStorm AI cuts Meta Ads CPA by 30% on average. No complex setup required.
Use the equal-age cohort analysis to compare return behavior. A retargeting report’s high ROAS can include customers who would have returned anyway; it does not establish a retention campaign causes two-to-five times more value than acquisition.
Illustrative economics: $100,000 net revenue at a 15% contribution margin leaves $15,000 before acquisition. Spending $20,000 on acquisition then yields a $5,000 shortfall before additional fixed costs. Revenue and profit need separate reporting. SBA break-even framework explains why variable costs matter to break-even analysis.
Turn the review into a test
Select one observed constraint, state the change and define its outcome and guardrails. Avoid fixed retention ROAS tables, compulsory top-10% referrer seeds and new objective names inferred from framework labels. AARRR helps ask the question; it does not supply a performance guarantee.
Compare contribution after refunds and repair cost
Illustrative extension: USD 100,000 booked revenue, USD 10,000 refunded revenue and 85% variable cost on the retained USD 90,000 leave 90,000×15%=USD 13,500 contribution before acquisition. Subtract USD 20,000 acquisition and USD 1,000 repair cost: result=−USD 7,500 before fixed costs. Assume the variable costs on refunded sales were fully reversed; if not, add unrecovered fulfillment/refund costs. These are hypothetical economics, not an observed profit statement.
| Hypothetical decision candidate | Value/effort assumption | Decision boundary |
|---|---|---|
| Repair confirmed broken setup control | USD 1,000 repair; restored path can be accepted without claiming profit lift | Fix and verify before a separate message experiment |
| Increase referral incentives | Cost and incrementality unknown | Do not prioritize merely because referral rate is 10% |
| Change one onboarding ad message | Owner-capped budget; qualified outcome after maturity | Test only after the destination repair passes |
Priority hypothesis for the NovaStorm brief: clarify the first useful setup step while keeping the same offer, audience eligibility and destination. Declare mature qualified outcomes and an owner-approved maximum loss; prepare and review the draft. Retention and referral outcomes remain separate business analytics, not assumed NovaStorm measurements or objectives inferred from AARRR.
Published by NovaStorm AI. Worked examples and test fixtures in this article are illustrative, not observed customer results.
Disclaimer: This article was generated with the assistance of AI and reviewed by the NovaStorm AI team. While we strive for accuracy, we recommend verifying specific data points and consulting official sources (linked where available) for critical business decisions.
Ready to automate your Meta Ads?
NovaStorm AI takes full responsibility for your campaigns — from monitoring to optimization.
Start NowMore on Metrics and reporting

North Star Metric for Meta Ads: Choosing the Right Optimization Goal
Choose a business success metric and a timely observable optimization signal, then validate their relationship with guardrails and mature cohorts.
Looker Studio and Meta Ads: Building Custom Performance Dashboards
Reproduce a spend-multiplying join, reconcile a corrected Meta dashboard, and test CPA, currencies, freshness and viewer access with fictional input rows.
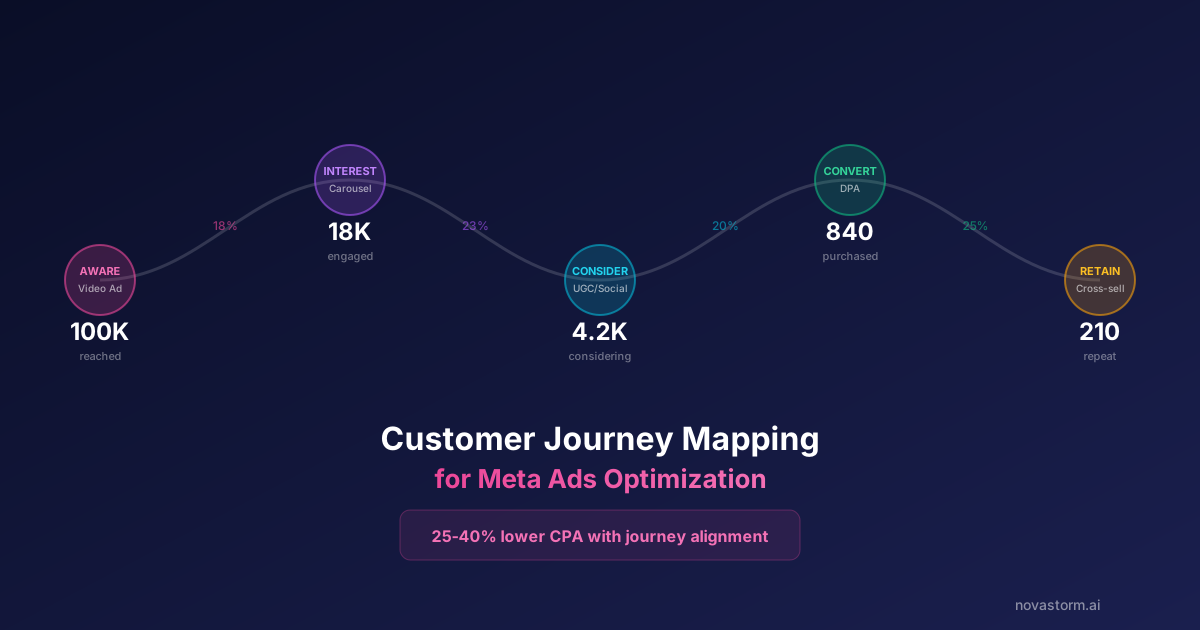
Customer Journey Mapping for Meta Ads Optimization
Build an evidence-based journey map, distinguish interviews from recorded events and test one pricing-message change with costs and mature outcomes.
Data Visualization for Meta Ads: Charts That Tell a Story
Verify Meta reporting charts with source rows, weighted CPA, join checks and accessible labels before drawing conclusions from a visual.