

Poll Ads on Meta: Interactive Engagement That Drives Clicks
Validate poll-ad availability and use aggregate votes carefully: separate response bias, rate calculations and commercial message testing.
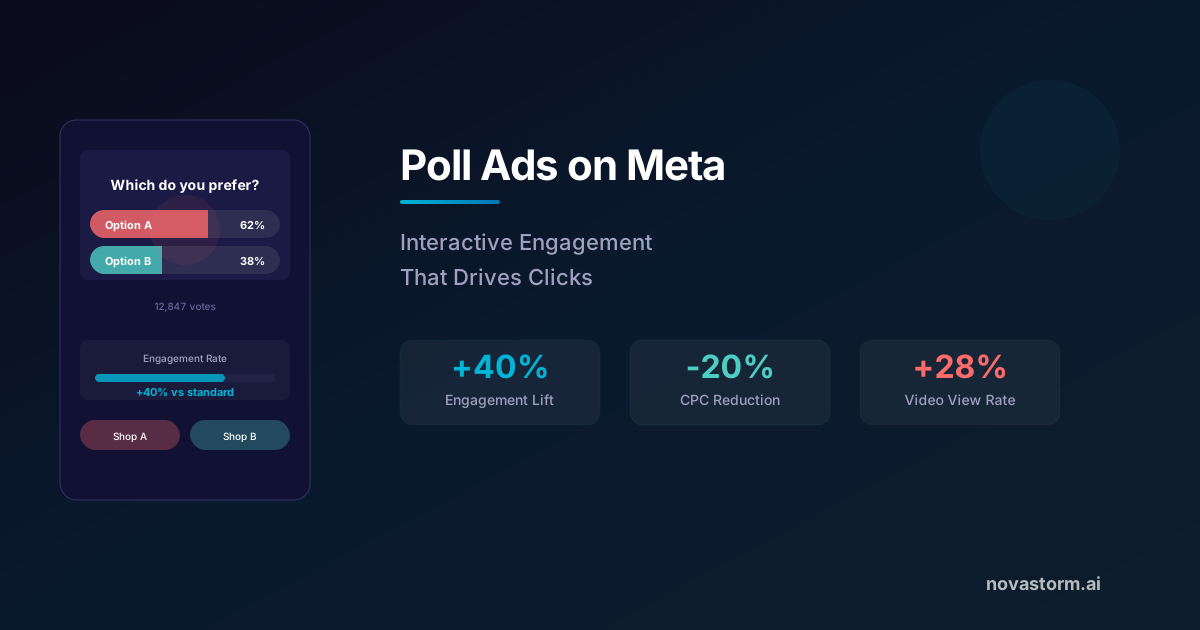
A poll can collect a low-effort response, but a vote is not a purchase, a representative interview or proof of intent. Before designing a campaign around it, verify whether the intended account, objective and placement currently offer the interaction. This guide does not assume a poll sticker exists in every Feed, Stories or Reels ad, or that a voter’s chosen answer can be targeted later.
Check the interaction before designing the funnel
| Availability record | Evidence to obtain |
|---|---|
| Account and placement | Dated preview of the actual supported control |
| Question and answer lengths | Accepted UI values and readable mobile output |
| After-vote path | Test whether voting and following a link are separate actions |
| Reporting | Actual available aggregate columns, with denominators |
| Audience reuse | Verified supported source; do not infer answer-level targeting from aggregate votes |
If the format is unavailable, use a conventional comparison creative with a normal destination. Do not draw a fake tappable poll or imply that an unsupported interaction works. Record the fallback in the brief.
A product-preference question with an honest limit
Hypothetical coffee-product brief: show the same pack and price, asking "Which flavor would you explore first?" with "Cocoa" and "Citrus" options. Equalize image scale and lighting; both options lead to accurate product information. Do not infer dietary needs, purchase readiness or personal beliefs from a tap. This is an illustrative creative, not research from 500 campaigns.
| Hypothetical observation | Calculation | Limit |
|---|---|---|
| 200 votes from 1,000 eligible shown impressions | 200 / 1,000 = 20% vote rate | Counts are synthetic; repeated impressions are not unique respondents |
| 70 of 200 votes choose Cocoa | 70 / 200 = 35% option share | 35% is a level, not a 35% improvement |
| Control vote rate 20%; variant 27% | (27% - 20%) / 20% = 35% relative growth | 7 percentage points; not the same as 35% option share |
| 50,000 volunteered responses | Large self-selected sample | Size alone does not remove selection bias |
Stop wasting ad budget
NovaStorm AI cuts Meta Ads CPA by 30% on average. No complex setup required.
Separate preference from sampling bias
- Record who could see and answer, delivery dates, placements and missing responses.
- Reverse option order in a separately designed allocation check; compare aggregate preference while retaining the same offer.
- Compare respondents with the intended customer population using permissible aggregate characteristics; disclose gaps rather than calling it representative.
- Use interviews to understand why an option was chosen; a vote cannot supply the explanation.
- Avoid forcing a 70% budget share to the most-voted answer; test commercial messages separately.
Test the message against a paid outcome
Hypothesis: a flavor message chosen from the exploratory poll improves purchase contribution. Prepare two truthful messages with the same price, product, audience eligibility and destination; declare assignment, total risk ceiling and outcome maturity before launch. Track media and production cost, paid orders, refunds and contribution. Poll votes, clicks and orders need separate denominators. No +40% engagement, -20% CPC or 2.5x retargeting uplift is established here.
Use the poll summary as one input to a NovaStorm campaign brief, then review the generated wording and destination manually. This does not promise NovaStorm poll publication, voter identity extraction or individual response-based segments.
Published by NovaStorm AI. Worked examples and test fixtures in this article are illustrative, not observed customer results.
Disclaimer: This article was generated with the assistance of AI and reviewed by the NovaStorm AI team. While we strive for accuracy, we recommend verifying specific data points and consulting official sources (linked where available) for critical business decisions.
Ready to automate your Meta Ads?
NovaStorm AI takes full responsibility for your campaigns — from monitoring to optimization.
Start NowMore on Ad formats and placements
Augmented Reality Ads on Meta: Interactive Try-On Campaigns
Evaluate an AR or product-demo destination without relying on obsolete Spark instructions; verify support, camera fallback, unit costs and confirmed outcomes.
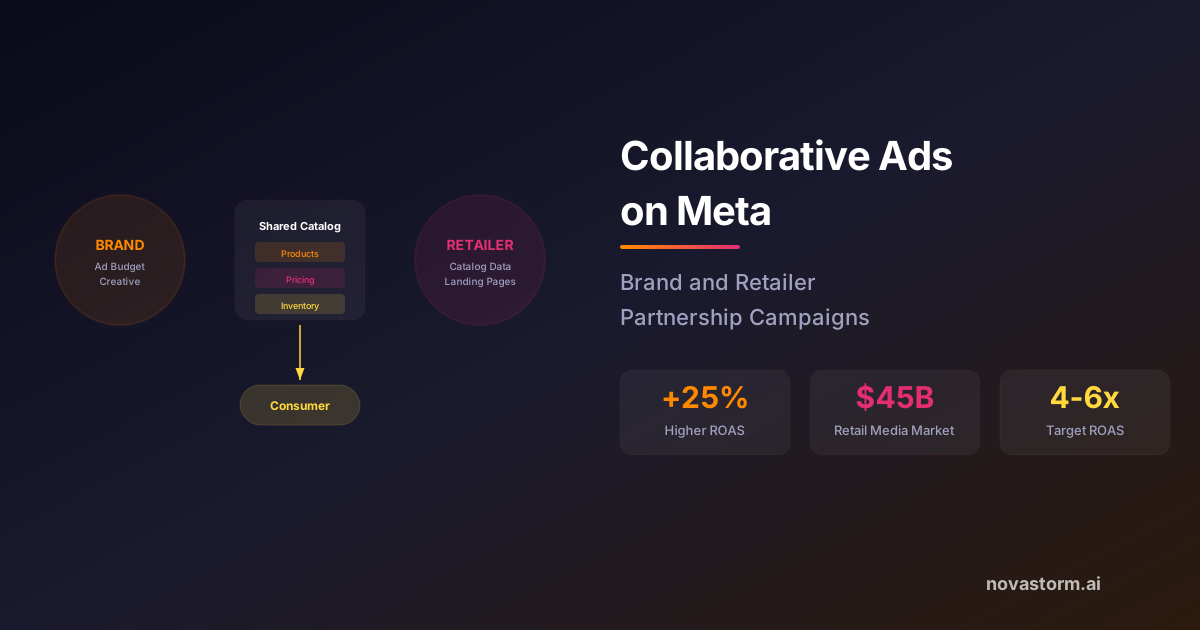
Collaborative Ads on Meta: Brand and Retailer Partnership Campaigns
Prepare a brand–retailer campaign agreement, validate shared-product access and reconcile reporting before funding collaborative advertising.
Playable Ads on Meta: Interactive Ad Formats for Mobile
Build a faithful playable prototype, verify the actual placement contract, and measure interaction-to-install outcomes with explicit denominators.

Meta Ad Creative Field Limits & Crop Specs: Technical QA Workflow
Audit ad creative text limits, enforce punctuation rules, configure placement image crops, and validate preview iframes before publishing on Meta.