

Marketing Mix Modeling and Meta Ads: Budget Allocation Science
Build a defensible MMM budget scenario: inspect channel identification, seasonality, held-out predictions, uncertainty and contribution margin.
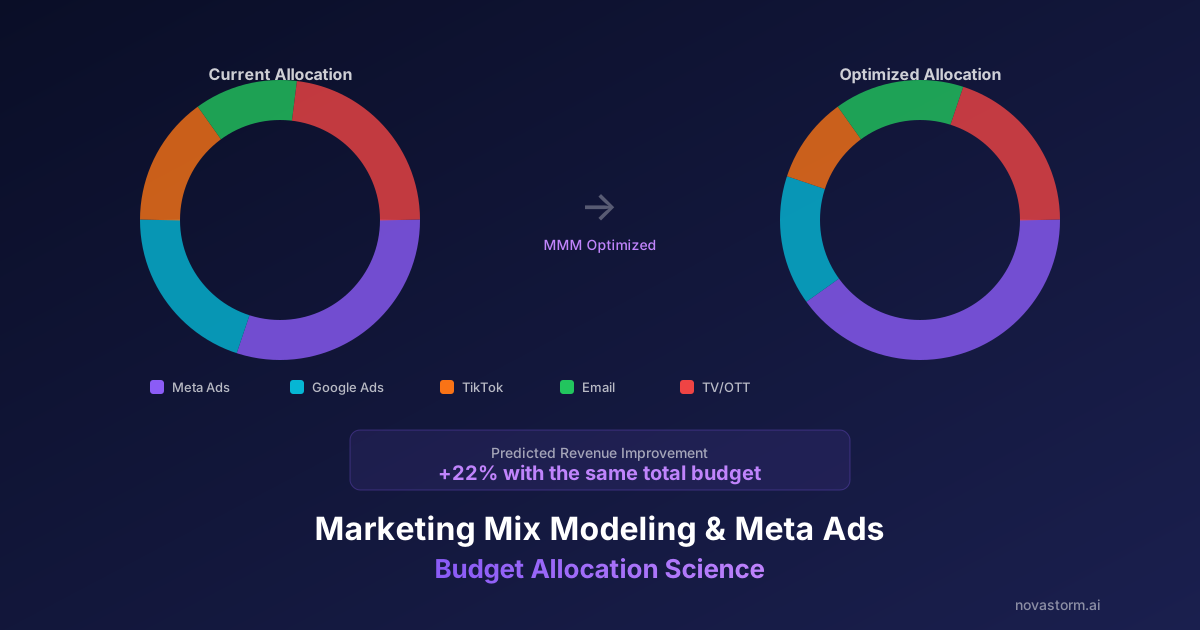
Marketing mix modeling (MMM) estimates how aggregate outcomes relate to media, business conditions and time. Use it to develop budget scenarios, then challenge those scenarios with experiments and financial constraints. A fitted coefficient is not automatically a causal contribution: promotions, demand and correlated channel spending can explain the same observations.
Prepare the decision and the dataset
- Define an outcome and its accounting basis: retained revenue, units or contribution. Keep currency, geography, dates and refund treatment consistent across media and business data.
- Collect channel spend and exposure where available, price, promotions, distribution, stockouts and demand factors. Document how each control could affect both spending and outcomes; avoid conditioning on a downstream effect of advertising.
- Examine seasonal cycles, trend changes and business interventions before choosing a training window. More rows do not compensate for no independent variation between channels.
- Keep a later time window out of fitting, and record which budget decisions the observed spend range can support. Large extrapolations require stronger evidence.
A completed teaching example: two explanations fit equally well
All numbers below are synthetic teaching units, not NovaStorm or client observations. Search spend is exactly twice Meta spend. The promotion starts in week 3.
| Week | Meta spend | Search spend | Promotion flag | Revenue |
|---|---|---|---|---|
| 1 | 10 | 20 | 0 | 140 |
| 2 | 20 | 40 | 0 | 180 |
| 3 | 30 | 60 | 1 | 240 |
| 4 | 40 | 80 | 1 | 280 |
Model A: Revenue = 100 + 2 × Meta + 1 × Search + 20 × Promotion. Model B: Revenue = 100 + 0 × Meta + 2 × Search + 20 × Promotion. Both reproduce every row exactly. The channel columns are linearly dependent, so these observations cannot identify separate Meta and Search effects. A perfect fit does not select Model A over Model B.
These four weeks also cannot identify an annual seasonal pattern. Before a production model, plot outcomes and media across relevant cycles, inspect promotion timing and independent spend changes, and run sensitivity checks with defensible seasonal and trend terms. When holiday demand and media rise together, changing the seasonal specification can change the attributed media effect. Treat that instability as uncertainty, not proof of additional advertising value.
Separate prediction checks from causal validation
Stop wasting ad budget
NovaStorm AI cuts Meta Ads CPA by 30% on average. No complex setup required.
For an additional synthetic held-out week, Meta = 50, Search = 100, promotion = 0 and observed revenue = 330. Both teaching models predict 300, an absolute error of 30, or 9.09% of observed revenue. This detects prediction error but does not resolve the channel identification problem. Evaluate errors over multiple held-out windows and business regimes; there is no universally sufficient error cutoff.
A production specification may use carryover and saturation transformations, seasonal terms, trend and business controls. Priors or regularization stabilize fitting but do not create missing independent variation. Check parameter sensitivity and whether credible incremental experiments measure the same outcome, geography and time horizon as the modeled effect.
Turn a forecast into an economic decision
Hypothetical scenario: an extra $1,000 of media forecasts $1,800–$3,200 of incremental retained revenue. Assume a 40% contribution margin before media and another $100 of execution cost. Net incremental contribution ranges from $1,800 × 0.40 − $1,000 − $100 = −$380 to $3,200 × 0.40 − $1,000 − $100 = $180. This is an assumed scenario range, not an estimated confidence interval or observed lift.
- Use the margin applicable to the incremental product mix, including fulfillment, discounts and returns.
- Check that a proposed allocation stays within a defensible spend range. Derive any saturation curve from the model and sensitivity analysis; do not assume a fixed percentage or multiplier for every advertiser.
- Limit a trial to an approved loss allowance, compare mature outcomes with the forecast and revisit the model when business conditions change.
- Use independent incrementality evidence where feasible before treating a favorable regression scenario as a reason to scale.
Implementation references and the next step
The primary implementations are Meta Robyn and the PyMC Marketing MMM example. Google Meridian explains causal assumptions and why model fit is an indirect diagnostic. Choose an implementation with an analyst who can inspect its assumptions and uncertainty.
After approving a Meta-specific scenario, use NovaStorm to prepare a campaign draft from the brief. Review saved budget and campaign fields before publication. The modeling, cross-channel allocation and causal validation described here require a separate analytical workflow.
Published by NovaStorm AI. Worked examples and proposed tests are labeled in the article.
Disclaimer: This article was generated with the assistance of AI and reviewed by the NovaStorm AI team. While we strive for accuracy, we recommend verifying specific data points and consulting official sources (linked where available) for critical business decisions.
Ready to automate your Meta Ads?
NovaStorm AI takes full responsibility for your campaigns — from monitoring to optimization.
Start NowMore on Attribution and incrementality
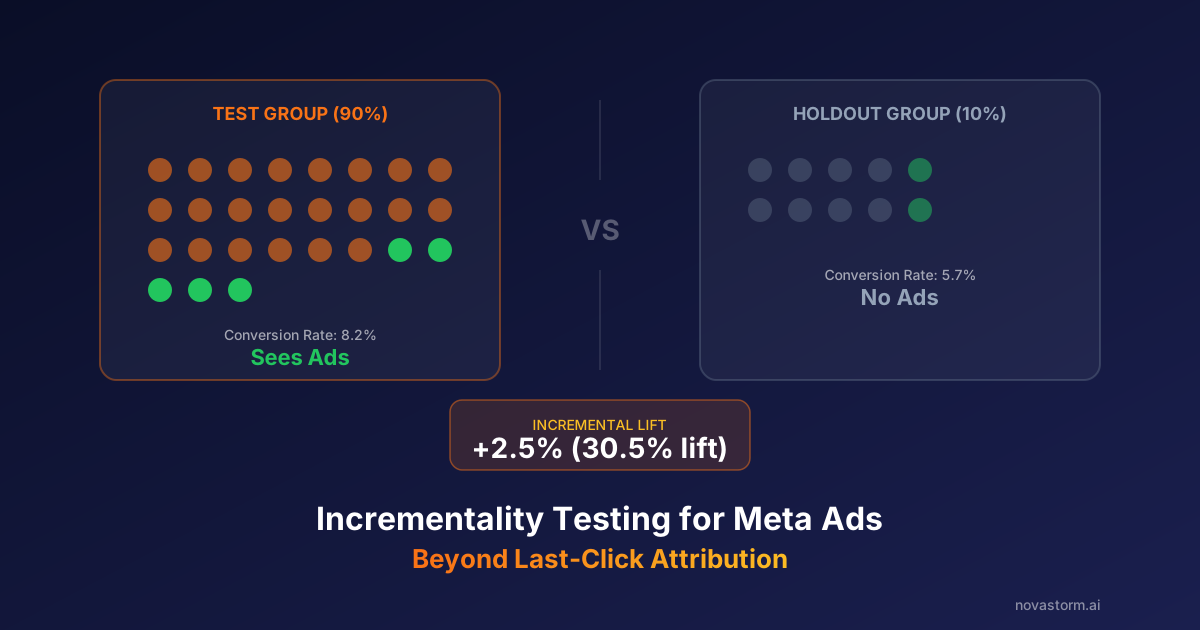
Incrementality Testing for Meta Ads: Beyond Last-Click Attribution
Design an incrementality test with a defined holdout, group-based sample assumptions, effect intervals and contribution economics.
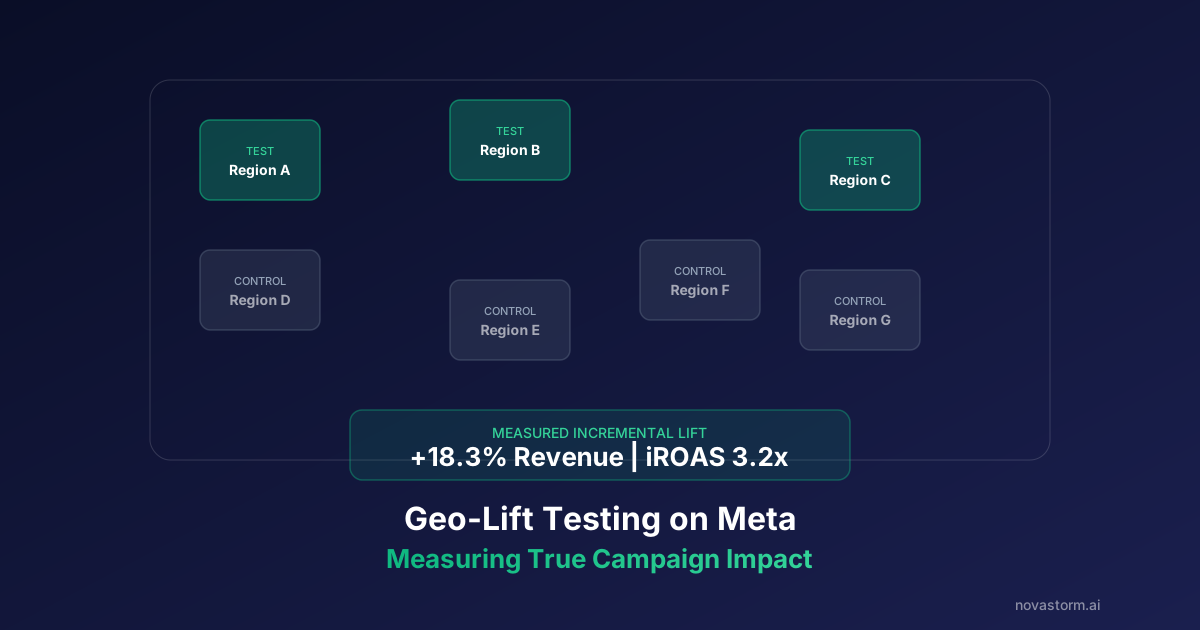
Geo-Lift Testing on Meta: Measuring True Campaign Impact
Design a geo-lift test with GeoLift tutorial data, pre-period checks, power planning and margin-based decisions that account for uncertainty.

Incremental Lift Testing on Meta: Measuring True Ad Impact
Design and interpret a randomized advertising holdout with unequal-group normalization, sample assumptions, uncertainty and a contribution ceiling.

Blended ROAS: Why You Should Stop Optimizing Per-Channel
Reconcile blended ROAS denominators, refunds and contribution margin, and separate cross-channel reporting from evidence of incremental lift.