

Thumb-Stop Rate: Calculate Attention and Check Acquisition Cost
Calculate thumb-stop rate with a consistent impression denominator and evaluate openings against mature acquisition cost, not attention alone.
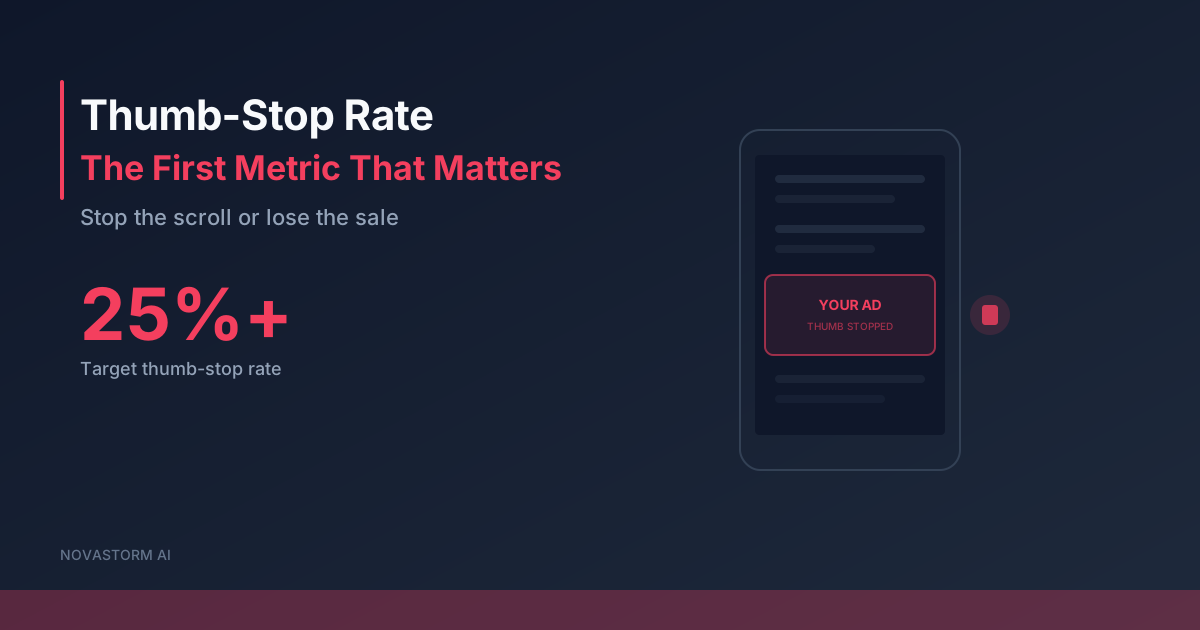
Thumb-stop rate is a custom attention ratio, not a direct measure of persuasion, unique viewers or profit. Use it to ask whether an opening communicates enough relevance to continue watching. A purchase does not require a recorded three-second play, and strong attention can coexist with poor business results.
Fix the numerator and denominator
For this guide, thumb-stop rate means the selected Meta three-second video-play count divided by impressions for the same ad and period, multiplied by 100. Save the actual column tooltip and reporting date. Check its treatment of very short videos and replays before using it; for an opening test, use videos longer than three seconds and the same reporting definition for all versions.
Hypothetical example: 12,500 qualifying plays divided by 50,000 impressions equals 25%. The numerator is plays, not 12,500 verified unique people. If the same report reaches 20,000 people, dividing those plays by reach gives 62.5%, but it is a different ratio and still does not count unique watchers. Do not label it as the percentage of people who stopped.
An image ad has no three-second video-play numerator. Report its link CTR or another available response metric separately rather than presenting it as equivalent video attention. Ratios using impressions, video starts and unique reach answer different questions.
Compare against your own relevant baseline
Match objective, reporting period, placement mix, audience definition and metric definitions before comparing openings. A change in delivery mix can change the ratio without a better opening. There is no verified universal 15–35% grading scale in this article, and a decline alone does not establish creative fatigue.
Contrast, a visible product action, a permitted human face and an early explanatory line are candidate creative hypotheses. None guarantees a percentage improvement. Keep the claim truthful and show the actual product job; avoid a shocking opening that attracts viewers who have no reason to buy.
Attention and CPA can disagree
Stop wasting ad budget
NovaStorm AI cuts Meta Ads CPA by 30% on average. No complex setup required.
| Hypothetical ad | Impressions / three-second plays | Defined attention ratio | Spend / mature retained orders | Media CPA |
|---|---|---|---|---|
| A: curiosity-led opening | 10,000 / 4,000 | 40% | $200 / 4 | $50 |
| B: specific product opening | 10,000 / 2,000 | 20% | $200 / 10 | $20 |
These are assumed worksheet values, not an observed comparison. A has higher attention but worse mature CPA; B reaches fewer qualifying plays yet delivers more retained orders. A’s opening may attract unqualified attention, but that explanation is a hypothesis requiring investigation. Placement mix, offer clarity and measurement can also explain the difference.
If attention is high and CPA poor, inspect the promise, destination, buyer eligibility and order quality before adding more visual interruption. If attention is lower and mature economics acceptable, preserve the effective asset while testing a clearer opening. A higher ratio is not the acceptance criterion by itself.
Run an opening experiment with a loss limit
- Keep the product, offer, video body, CTA, captions and destination consistent. Change one opening element and record any unavoidable transition difference.
- Define the primary outcome, maximum acceptable acquisition cost, loss limit and maturation interval before publication. Base the interval on purchase or lead-qualification delay.
- Use an eligible randomized experiment with overlap control when causal evidence matters. Multiple ads in one ad set receive adaptive delivery; equal nominal budgets alone do not establish a randomized test.
- Collect each arm’s impressions, qualifying plays, reach, spend, mature retained orders or qualified outcomes, and placement mix. A low-delivery arm can remain inconclusive.
- Review on the declared schedule after sufficient mature outcomes and stop at the agreed loss limit or measurement failure. Seventy-two hours is not a universal sufficient duration.
- Choose an opening only if it meets the business criterion and communicates the approved message accurately; report uncertainty and retain the baseline when evidence is inconclusive.
Keep asset, hypothesis and result together
Use the creative testing framework for an asset log and the fatigue diagnosis guide before attributing a trend to repeated exposure. The log should contain the numerator, denominator, dates and outcome-maturation rule, not just a screenshot of a percentage.
NovaStorm can support proposed preparation of paused campaign and local ad-set drafts for human review. This example does not establish automatic attention measurement, opening editing or a profitable winner-selection feature.
Published by NovaStorm AI. Planning examples are illustrative assumptions, not measured customer results.
Disclaimer: This article was generated with the assistance of AI and reviewed by the NovaStorm AI team. While we strive for accuracy, we recommend verifying specific data points and consulting official sources (linked where available) for critical business decisions.
Ready to automate your Meta Ads?
NovaStorm AI takes full responsibility for your campaigns — from monitoring to optimization.
Start NowMore on Visual creative and design

The Psychology of Color in Meta Ad Creative
Choose a readable Meta ad palette, distinguish drawn labels from native controls, and test one color parameter against mature paid outcomes.
E-commerce Product Photography for Meta Ads: Plan and Test Visual Styles
Plan product-only, contextual and detail photos with accuracy and rights checks, then compare mature customer economics including production cost.
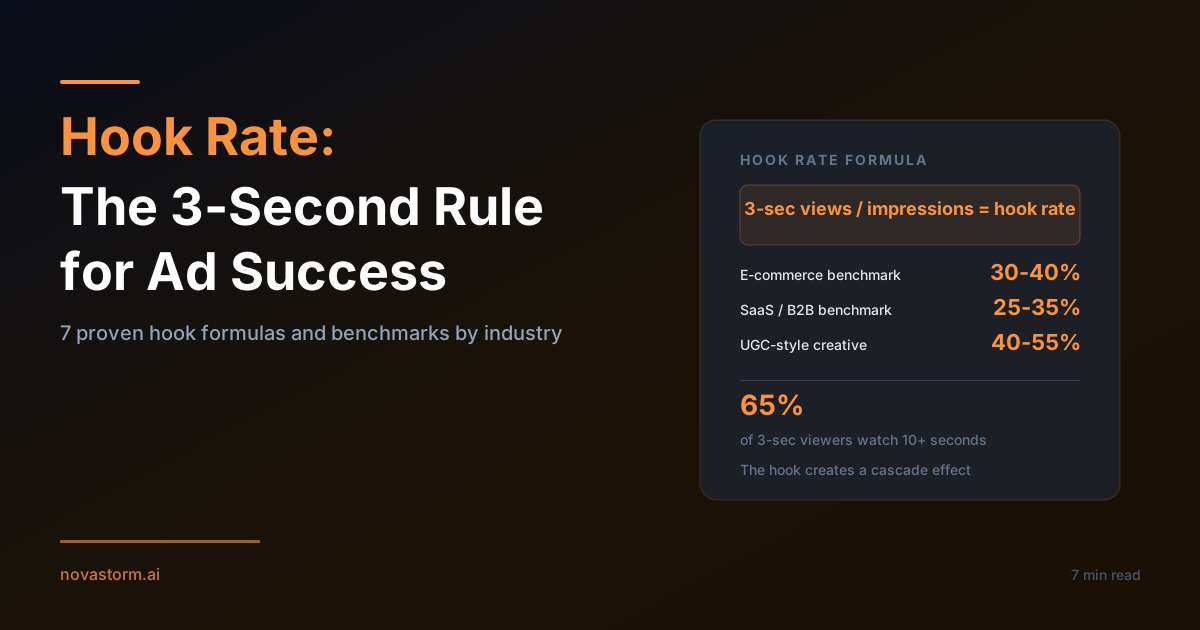
Hook Rate in Meta Ads: Diagnose Attention Without Ignoring Sales
Use hook rate as an attention diagnostic and compare seven openings with mature acquisition outcomes, allocation checks and a loss cap.
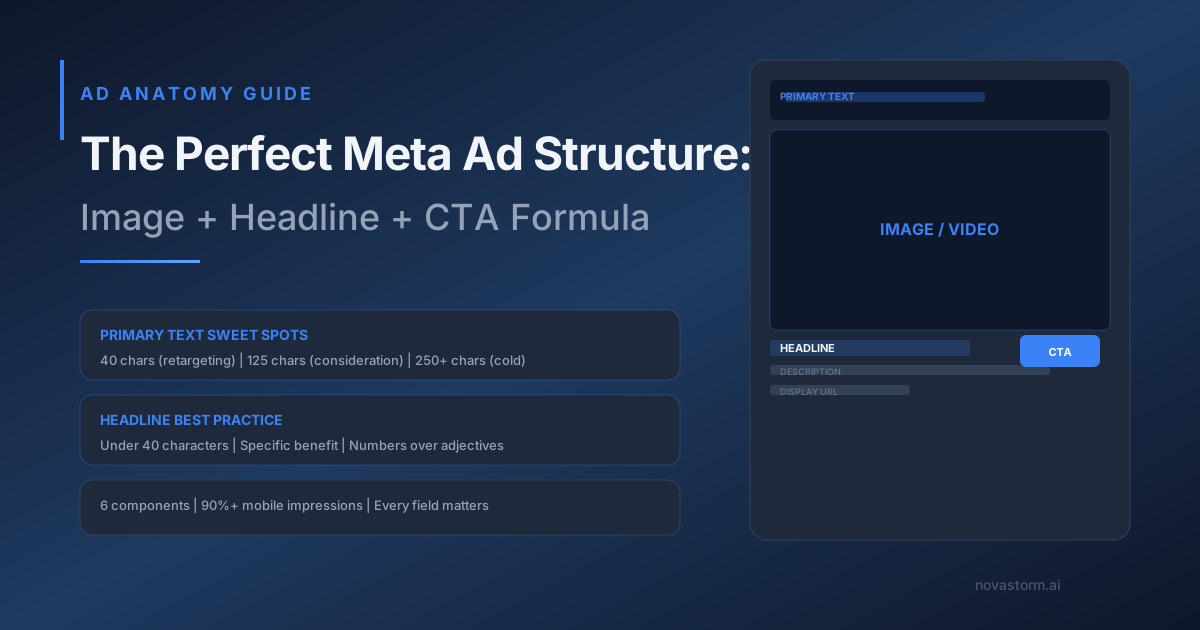
The Perfect Meta Ad Structure: Image + Headline + CTA Formula
Review every ad field across mobile placements, verify the landing-page promise and test one truthful field using mature sales.