

Statistical Significance in Ad Testing: When Results Are Real
Calculate independent binary-test samples, distinguish significance from contribution, and decide whether budget and outcome delays support a test.
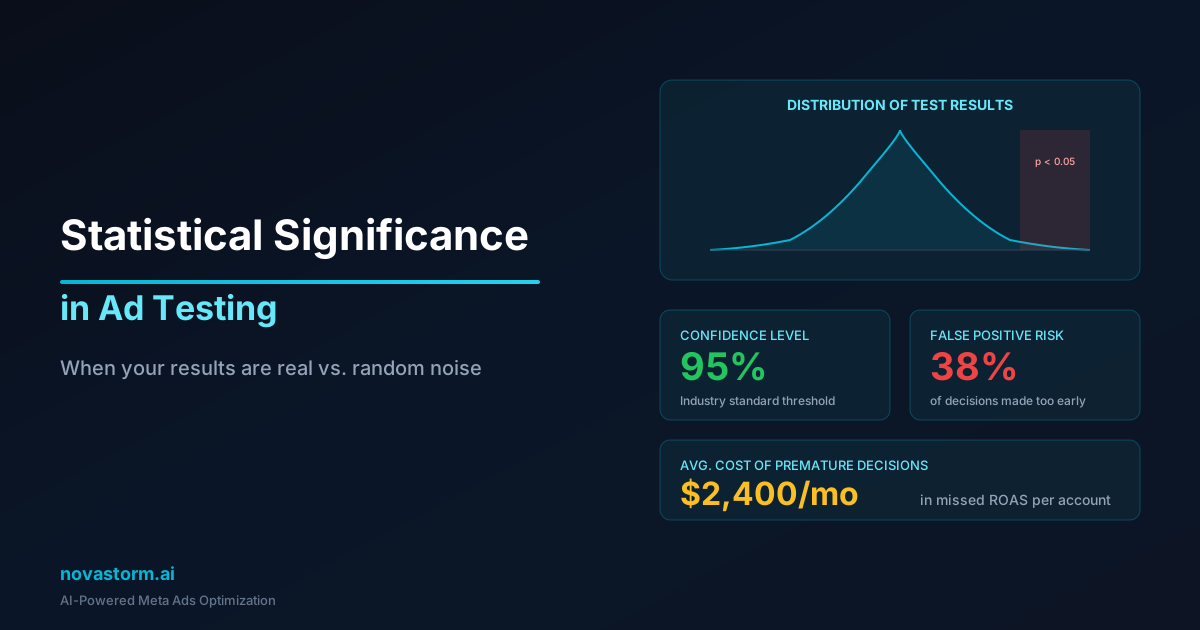
This guide covers two independent, equally sized, randomized visitor groups and one binary purchase outcome per visitor. CPA, ROAS, repeated exposures and clustered assignment need other analysis designs. Define the operational question in the experiment card before using a calculator.
Specify a meaningful effect
Moving from 2% to 2.4% means +0.4 percentage points or +20% relative. For a two-sided α of 0.05 and 80% power, let p̄ = (p1 + p2)/2. The equal-group normal approximation is n ≈ [1.96√(2p̄(1−p̄)) + 0.842√(p1(1−p1)+p2(1−p2))]²/(p2−p1)² per group. Round up, then use a validated design-specific calculation for the actual test.
| Illustrative rates | Approximate visitors per group, rounded for planning |
|---|---|
| 1% → 1.3% | 19,900 |
| 2% → 2.4% | 21,200 |
| 3% → 3.6% | 14,000 |
| 5% → 5.75% | 14,200 |
A large apparent lift with insufficient evidence
Hypothetical result: 20/1,000 versus 24/1,000 paid orders. The difference is 0.004, pooled rate 0.022, null standard error about 0.00656, z ≈ 0.61 and two-sided p ≈ 0.54. An approximate unpooled 95% interval is −0.89 to +1.69 percentage points. The apparent 20% relative lift is not established. An inconclusive result does not prove equality.
A significant effect can be commercially small
Separate hypothetical example: 20,000/1,000,000 versus 20,500/1,000,000 paid orders. The absolute increase is 0.05 percentage points, or 2.5% relative. A pooled normal test gives z about 2.51 and p about 0.012; the approximate difference interval is +0.011 to +0.089 percentage points. These are synthetic counts under the stated independent design, not NovaStorm customer results.
Assume incremental contribution is only $5 per extra retained order, and implementation costs $10,000. The point estimate of 500 extra orders contributes $2,500, leaving −$7,500 after implementation. The interval corresponds roughly to 110–890 extra orders per million visitors, still only about $550–$4,450 contribution under those assumptions. Statistical distinguishability alone would not justify this cost.
Check feasibility and follow-up before enrollment
Stop wasting ad budget
NovaStorm AI cuts Meta Ads CPA by 30% on average. No complex setup required.
Illustrative budget: 42,400 eligible visitors for the 2% → 2.4% planning row at $0.80 each costs $33,920. At 2,000 eligible visitors per day, enrollment needs about 22 days. If the chosen purchase window is seven days, wait for the last enrolled cohort to mature before the final review, roughly day 29. Delivery, identity loss and event exclusions can extend this schedule.
A $5,000 budget at the same assumed visitor cost buys only 6,250 visitors. Do not promise the original effect sensitivity. Defer the test, find a justified larger effect worth testing, or reduce scope after a new calculation. Repair a confirmed defect directly and document the repair rather than manufacturing significance.
A protocol you can fill before launch
| Field | Filled illustrative value | Replace with your real decision |
|---|---|---|
| Eligible unit | One consent-eligible stable visitor ID | Identity scope and repeat-visit rule |
| Outcome | Any confirmed paid purchase within seven days | Event definition, qualification and maturation |
| Assignment | Equal independent randomized A/B groups | Implemented randomization and contamination checks |
| Planning inputs | 2%, 2.4%, α 0.05, power 80% | Evidence-backed baseline and meaningful effect |
| Analysis | Two-proportion comparison and effect interval | Appropriate model and missing-data handling |
| Stopping | Fixed sample and completed follow-up | Sequential method if selected in advance |
| Guardrails | Contribution, refunds, failures | Risk thresholds and incident owner |
- Use a p-value as evidence about the specified null model, not as the probability a hypothesis is true. Report effect size and uncertainty alongside it.
- A frequentist 95% interval comes from a procedure with 95% long-run coverage under its assumptions; it is not a 95% probability attached to the fixed parameter.
- Do not repeatedly stop at the first favorable p-value without a valid sequential method. Prespecify multiple comparisons and reconcile assignment imbalance and missing outcomes.
- For CPA or ROAS, analyze unit-level spend and revenue under the design with a suitable ratio, bootstrap or randomization approach; a two-proportion test of impression counts is insufficient.
- For repeated users, stores, regions or other clusters, respect the assignment unit and dependence in both power and interval calculation. Consult a design-specific analyst rather than treating impressions as independent people.
Use product drafts as documentation, not evidence
Prepare the compared campaign briefs as NovaStorm drafts, recording the intended outcome and review window in your experiment documentation. Synthetic demonstration rows and draft preparation cannot prove significance, attribution or an observed performance lift.
Source: ASA statement on p-values. The numerical examples are calculations from explicit hypothetical inputs.
Published by NovaStorm AI. Worked examples and proposed tests are labeled in the article.
Disclaimer: This article was generated with the assistance of AI and reviewed by the NovaStorm AI team. While we strive for accuracy, we recommend verifying specific data points and consulting official sources (linked where available) for critical business decisions.
Ready to automate your Meta Ads?
NovaStorm AI takes full responsibility for your campaigns — from monitoring to optimization.
Start NowMore on Creative and audience testing
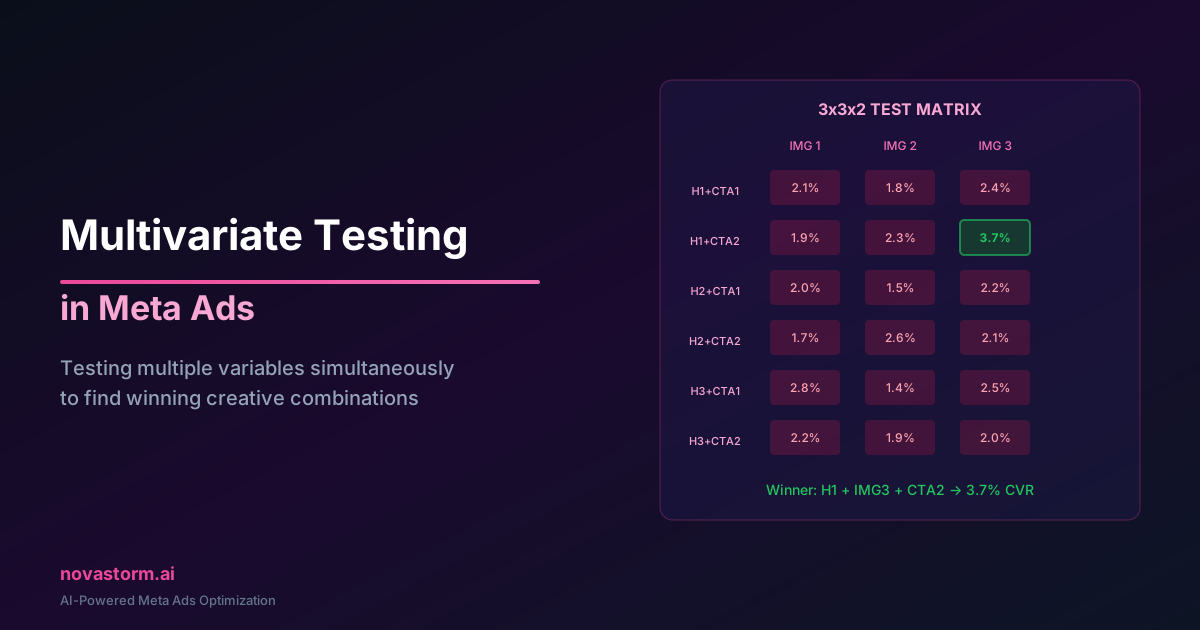
Multivariate Testing in Meta Ads: Testing Multiple Variables
Build an 18-cell creative matrix, distinguish adaptive delivery from random assignment, and plan interactions, uncertainty and an affordable comparison.
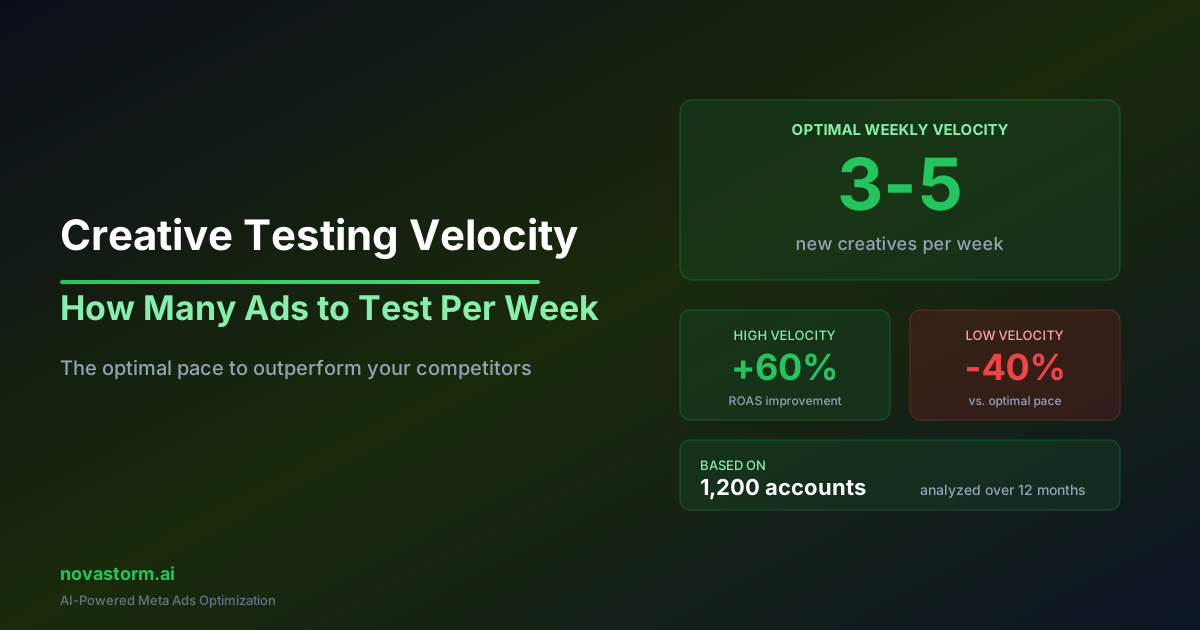
Creative Testing Velocity: How Many Ads to Test Per Week
Choose creative production pace from team hours, media budget and mature evidence; keep asset counts separate from experimental conclusions.
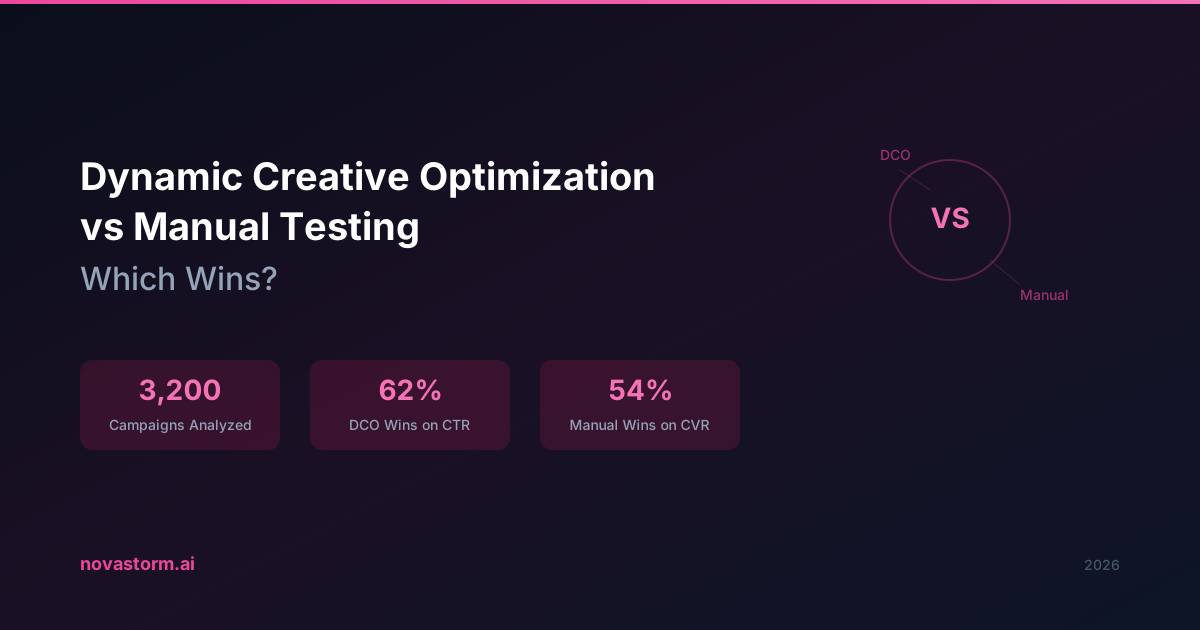
Dynamic Creative Optimization vs Manual Testing: Which Wins
Choose dynamic creative for exploration and controlled testing for causal conclusions, with correct combination counts and reviewed variants.
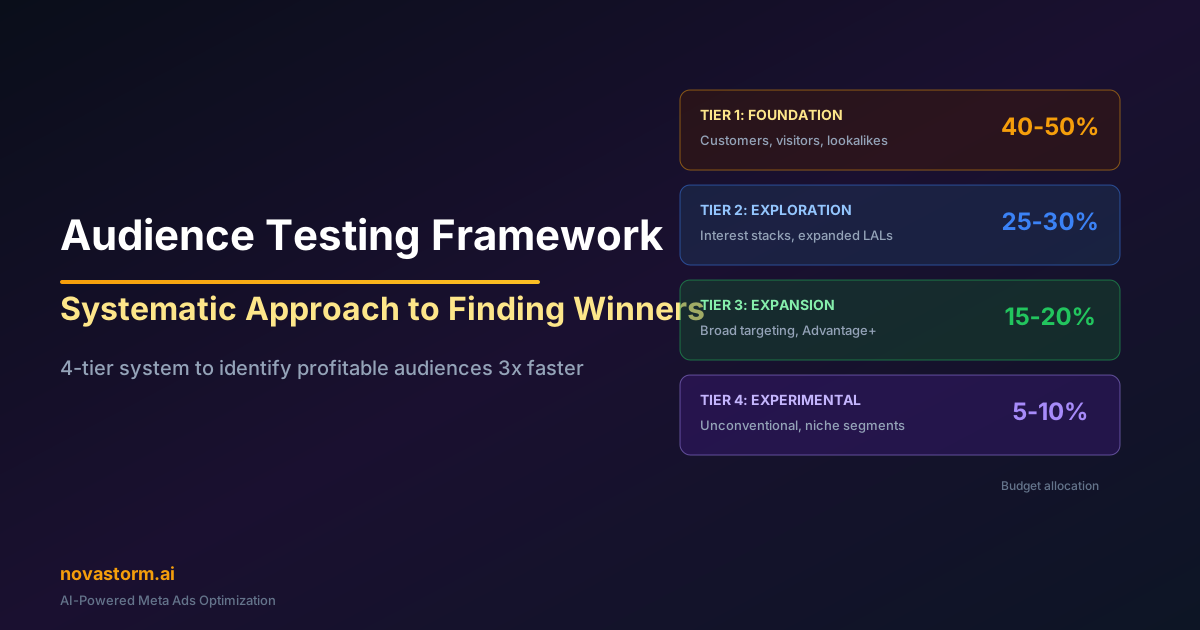
Audience Testing Framework: Systematic Approach to Finding Winners
Separate prospecting from warm retargeting, verify audience controls and overlap, and compare mature customer contribution under a clear test design.