

Marketing Funnel Metrics: What to Track at Every Stage
Reconcile campaign totals with session and order records, define mature cohorts and derive an allowable CPA from contribution and a profit reserve.
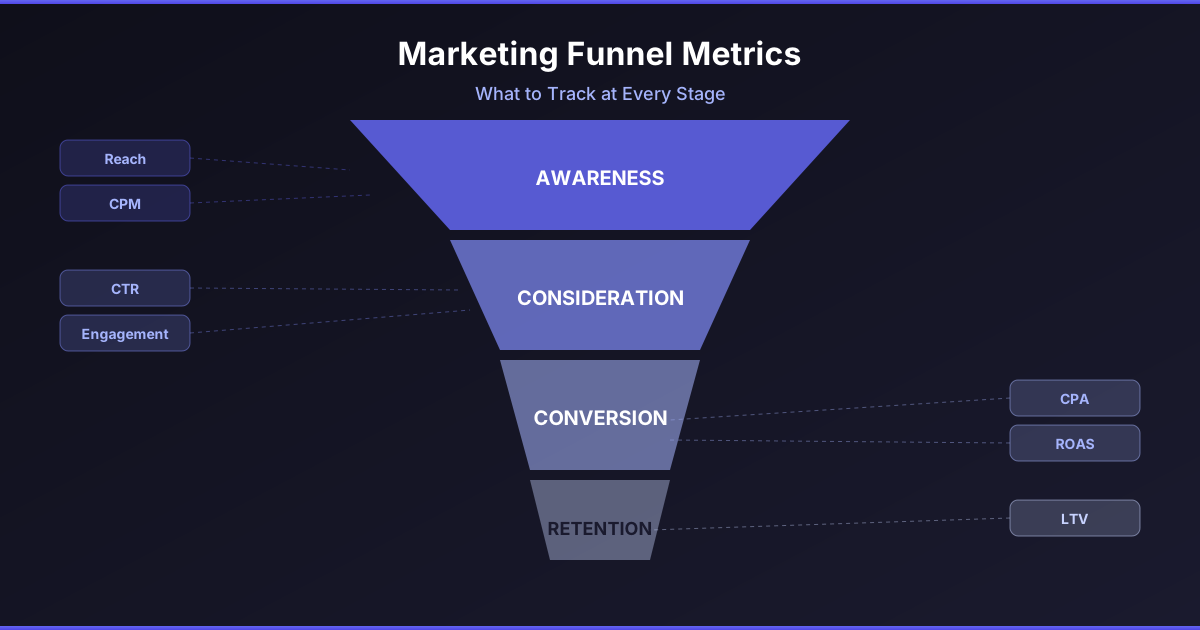
A funnel report supports a decision only when its units and population are explicit. Impressions, reach, clicks, sessions, orders and customers are different counts. Decreasing totals do not establish that the same people completed a sequence.
Preserve the arithmetic and specify the denominator
| Hypothetical campaign total | Calculation |
|---|---|
| Spend $200; 20,000 impressions | CPM = $200 / 20,000 × 1,000 = $10 |
| 400 link clicks | Link CTR = 400 / 20,000 = 2% |
| Spend and link clicks | CPC = $200 / 400 = $0.50 |
| 10 attributed purchases | Attributed CPA = $200 / 10 = $20 |
| Purchases / link clicks | 10 / 400 = 2.5% |
These are illustrative compatible campaign totals, not a recorded customer journey. Suppose a separately reconciled eligible site report contains 320 sessions and ten qualifying paid orders. Its order-to-session ratio is 10/320 = 3.125%, not 2.5%. Multiple clicks, loading failures, collection restrictions and session boundaries can affect the counts. Neither ratio proves a particular cause.
Link sessions to orders before calling a sequence a funnel
| Illustrative joined row | Session/order linkage | Interpretation |
|---|---|---|
| C1 → S1; user U1 | One eligible click opens S1; order O1 recorded in S1. | One click, one session and one order can be linked in this row. |
| C2 → S2; user U2 | Click opens S2; no order in that session. | A later return needs a separate session and a defined attribution rule. |
| S3; user U2 | Later return with no new tracked click; order O2. | An order may belong to a return session, not the original click session. |
| C3 → no collected session | Click recorded; no matching site session available. | Do not fabricate a session or assume the user bounced. |
This small join illustration is independent of the aggregate counts above and does not enumerate all 400 clicks or ten purchases. Use privacy-permitted identifiers and the actual identity/matching rule. Keep unmatched rows rather than forcing a one-to-one join or assigning every unknown source to paid advertising.
The GA4 funnel documentation distinguishes open entry from closed entry and requires the configured sequence. A user sequence, a session conversion ratio and an attributed campaign report therefore need separate labels.
Declare cohort entry, maturation and unknown sources
Teaching cohort rule: include users whose first eligible tagged Meta arrival occurs September 1–3; use a 14-day outcome window from each entry; review on September 20. Deduplicate paid orders by ID, mark refunds and keep an unknown-source segment separate. These dates and rows are synthetic.
Stop wasting ad budget
NovaStorm AI cuts Meta Ads CPA by 30% on average. No complex setup required.
| User | Entry/source | Order status | Cohort decision |
|---|---|---|---|
| U1 | Sep 1, tagged Meta | O1 paid Sep 3, retained by review | Included; one retained outcome within window. |
| U2 | Sep 2, tagged Meta | No qualifying order | Included; zero observed outcome, not proof of never buying. |
| U3 | Sep 3, tagged Meta | O3 paid Sep 5, refunded Sep 10 | Included; paid then refunded; zero retained outcome. |
| U4 | Sep 3, tagged Meta | O4 paid Sep 20 | Included entry; order lies outside its 14-day window. |
| U5 | Sep 2, source unknown | O5 paid Sep 6, retained | Keep in unknown segment; do not allocate to Meta. |
| U6 | Sep 19, tagged Meta | Outcome window still open | Outside entry dates; not part of mature cohort. |
In this miniature cohort, four users enter the defined Meta group and all four windows have matured by the review date. One retained order qualifies within the window. That is one outcome among four cohort entrants; it is not a general site-session conversion rate. The source-unknown order remains visible in overall business records without being reassigned to Meta. An outside-window order can be reported separately, not silently pulled into the result.
Continue contribution into an allowable CPA
An illustrative $80 retained order at a 40% contribution margin provides $32 before acquisition and the stated overhead allocation. If the business reserves $7 for profit/overhead and allocates $3 of other acquisition cost per order, the maximum media allowance is $32 − $7 − $3 = $22 on the same retained-order denominator. A mature $20 media CPA leaves $2 beyond those allocations. A $25 CPA would miss that declared allowance by $3.
Confirm whether margin already includes refunds, product, delivery and payment costs; count each cost once. Do not combine gross revenue from an initial-order report with retained-order costs or turn forecast repeat purchases into measured contribution.
Use comparable evidence for the budget decision
- Check currency, timezone, date window, attribution settings and cohort age before comparing periods.
- Reconcile attributed purchases with unique paid/retained orders and preserve unknown or missing data.
- Investigate click-to-session or session-to-order changes with the actual joined records; aggregate changes are diagnostic, not proof of causation.
- Compare mature acquisition cost with the declared contribution allowance and cash-risk limit. Reduce exposure on measurement failure or a breached limit rather than chasing a universal CTR grade.
Use equal-age cohorts and an action-oriented dashboard to record owners and evidence. NovaStorm can support proposed campaign preparation and review; unit checks and budget decisions use verified external reports here, not an assumed built-in joined funnel or monitoring feature.
Published by NovaStorm AI. Planning examples are illustrative assumptions, not measured customer results.
Disclaimer: This article was generated with the assistance of AI and reviewed by the NovaStorm AI team. While we strive for accuracy, we recommend verifying specific data points and consulting official sources (linked where available) for critical business decisions.
Ready to automate your Meta Ads?
NovaStorm AI takes full responsibility for your campaigns — from monitoring to optimization.
Start NowMore on Metrics and reporting
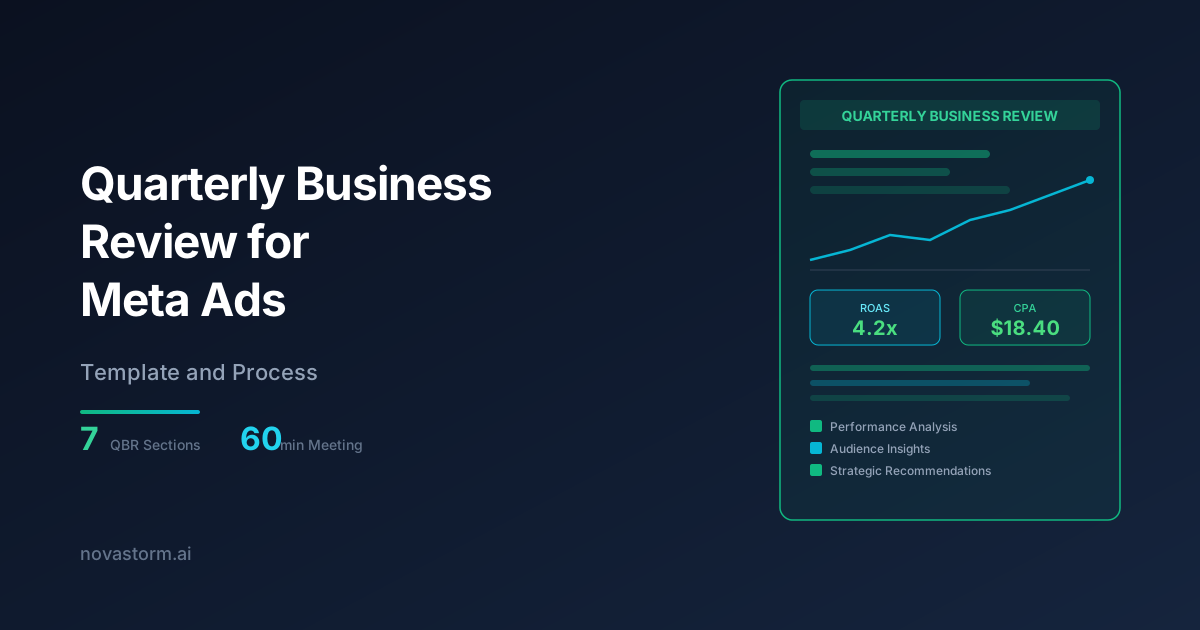
Quarterly Business Review for Meta Ads: Template and Process
Run a Meta Ads quarterly review with compatible metrics, explicit hypotheses, prioritized decisions and assigned follow-up.
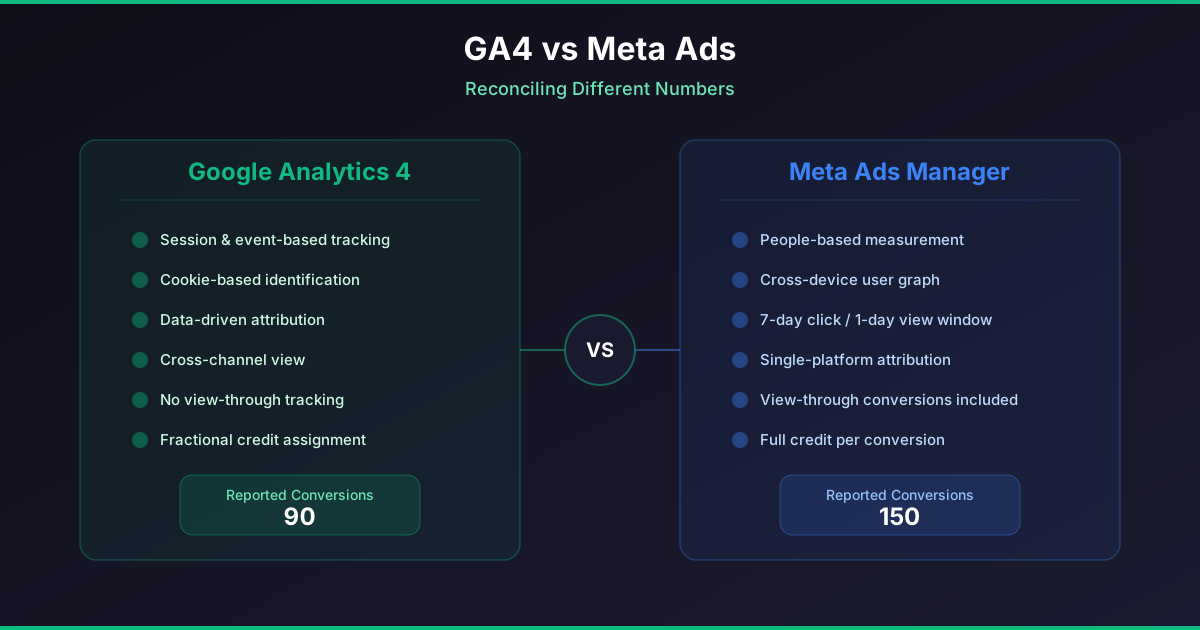
Google Analytics 4 and Meta Ads: Reconciling Different Numbers
Reconcile paid orders, refunds, collected events and channel credit in GA4 and Meta; use scoped local attribution tests and release acceptance checks.

Cohort Analysis for Meta Ads: Tracking Long-Term Customer Value
Assign orders and refunds to first-payment cohorts, measure source coverage and compare equal-age contribution before estimating acquisition payback.

Video Retention Metrics: How to Analyze Watch-Through Rates on Meta
Read video export columns with explicit denominators and replay limits, compare compatible edits and test attention alongside mature purchase cost.