

Heatmap Analysis for Meta Ads Landing Pages: Where Users Click
Use landing-page heatmaps as aggregate interaction evidence, with compatible segments and page versions, then validate a specific issue before changing the page.
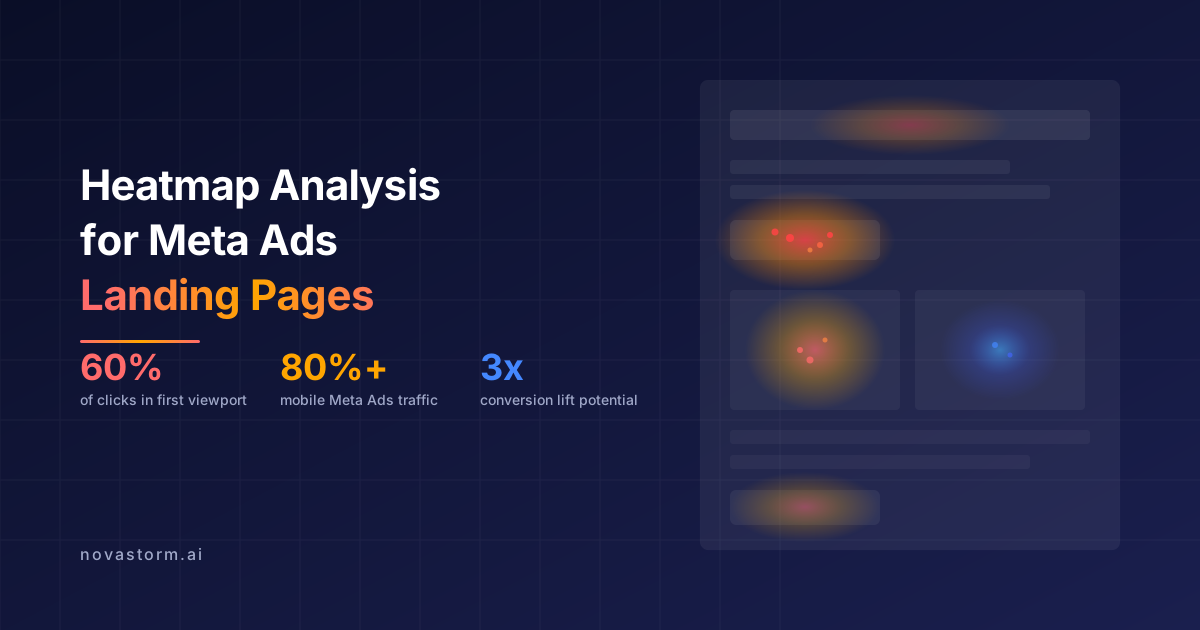
A heatmap is a way to locate a question worth investigating. It does not establish why someone clicked or whether a change increases sales. Start with a defined page version and recorded-session population, reproduce the suspected problem, and confirm the downstream result before making an advertising recommendation.
Build a reproducible sample
Hypothetical dataset, not collected customer data: page version A, one chosen seven-day period in UTC, Meta-tagged visits only. The worksheet counts sessions with at least one image click, not raw taps. Repeat taps in one session count once. The split below is invented for teaching; the 200 sessions are recorded sessions, not every visitor to the site.
| Recorded subset | Sessions | Sessions clicking the product image |
|---|---|---|
| Mobile Meta-tagged traffic | 120 | 24 |
| Desktop Meta-tagged traffic | 80 | 6 |
| Total | 200 | 30 |
Calculated image-click share: (24 + 6) / (120 + 80) = 30 / 200 = 15% of this illustrative recorded sample. Consent choices, blockers, filtering and recording availability can change who appears in a tool. Do not report this as 15% of all visitors or as a projected conversion improvement.
The diagram marks an element to inspect; its color and size do not encode measured heat intensity. The underlying table supplies the entire hypothetical dataset. Microsoft Clarity documents element-based click maps and filtering by page and device. A reconstructed map may combine different page states, so retain the URL, build version, filters and date range with your evidence.
Reproduce before explaining
Stop wasting ad budget
NovaStorm AI cuts Meta Ads CPA by 30% on average. No complex setup required.
- On the same version and viewport, tap the image once and twice. Check its cursor, surrounding copy, focus behavior and actual handler. A repeat tap may indicate an expected zoom action; it is not proof of frustration.
- Try the CTA with a keyboard and a pointer. Watch whether it opens the intended form and whether valid submission reaches an accepted backend result. Compare actual requests with analytics events.
- Investigate another explanation for a quiet CTA: visitors may already use a header form, read terms first, or arrive with a different intent. Count those alternate actions separately before calling the main CTA ineffective.
Masking must pass a separate check. Use synthetic names and addresses in a test session, including text added after page load. Clarity masking instructions explain explicit masking and that changes affect new recordings rather than retroactively rewriting old recordings. Confirm the captured replay hides the dynamic test text; do not record real personal data merely to test the mask.
Separate a repair from an idea
Proposed acceptance test, not an executed outcome: make the image clearly decorative or implement its advertised zoom action. Then use a synthetic inquiry in a test environment. Require an accessible validation message for invalid input, one accepted lead identifier for valid input, a matching success state, and no duplicate lead from repeat clicks. A frontend owner checks interaction and masking; a backend owner checks acceptance. A click or fired event alone is insufficient.
After functional acceptance, a different hypothesis can be tested: “An explicit image caption reduces uncertainty and improves qualified inquiries.” Choose a controlled comparison and a qualified-lead definition before launch. Keep traffic and page versions comparable and report uncertainty; the sample above does not predict the result.
Translate the verified finding into an ad brief: promised destination, product detail and next step. NovaStorm can help prepare a campaign draft for review; heatmap collection, masking and backend verification remain separate work. Use the landing-page optimization checklist to keep the ad promise and page action aligned.
Published by NovaStorm AI. Worked examples and test fixtures in this article are illustrative, not observed customer results.
Disclaimer: This article was generated with the assistance of AI and reviewed by the NovaStorm AI team. While we strive for accuracy, we recommend verifying specific data points and consulting official sources (linked where available) for critical business decisions.
Ready to automate your Meta Ads?
NovaStorm AI takes full responsibility for your campaigns — from monitoring to optimization.
Start NowMore on Landing pages and conversion

Instant Experience Ads on Meta: Full-Screen Mobile Landing Pages
Assess Meta Instant Experience as an in-app presentation path, verify current account support and measure the handoff to a confirmed business outcome.
Session Recording Analysis for Meta Ads Traffic: User Behavior Insights
Review sampled session recordings with a defined question, tested masking and separate observation, hypothesis and outcome validation.
Form Optimization for Meta Ads Lead Generation
Audit form purposes, mobile error states and submission boundaries, then compare qualified leads and mature sales with consistent costs.
Checkout Page Optimization for Meta Ads E-commerce Traffic
Audit checkout states, countries, guest and wallet paths, and retries; reconcile unique paid orders and refunds before approving an ad destination.