

Cohort Analysis for Meta Ads: Tracking Long-Term Customer Value
Assign orders and refunds to first-payment cohorts, measure source coverage and compare equal-age contribution before estimating acquisition payback.

A customer cohort groups unique customers by their first qualifying payment. Later purchases remain in that original cohort. A recorded campaign source describes the attribution rule you selected; it does not establish that advertising alone caused the customer to buy.
Reproduce the assignment from order rows
The following small dataset is hypothetical and separate from the 200-customer example below. Define first payment as the earliest settled paid order for a stable customer ID, excluding test orders and cancellations. Use one business time zone. A later refund changes contribution but does not silently move the customer into a later acquisition month.
| Customer | Record and date | Revenue change | Original cohort | Recorded acquisition source |
|---|---|---|---|---|
| C01 | Order O01 paid Jan 5, 2026 | +100 | 2026-01 | Meta under the declared source rule |
| C01 | Order O02 paid Feb 12, 2026 | +60 | 2026-01 | Same original source; repeat order |
| C01 | Partial refund of O01 settled Feb 20, 2026 | −20 | 2026-01 | Same original source; refund adjustment |
| C02 | Order O03 paid Jan 8, 2026 | +80 | 2026-01 | Unknown |
| C03 | Order O04 paid Feb 3, 2026 | +90 | 2026-02 | Newsletter |
Formula: first_payment(customer) = minimum qualifying paid_at across that customer’s order history; cohort_month = year-month of first_payment in the chosen time zone. Join every later valid order and refund through customer ID and original order ID. Calendar age = 12 × (record year − cohort year) + (record month − cohort month). With monthly calendar buckets, January repeats are age 0 and February records for C01 are age 1; this is not the same as exact elapsed days.
C01 contributes $140 retained revenue before variable costs: $100 + $60 − $20. The January cohort also includes C02, giving $220 retained revenue across two customers. Unknown source remains a row, not a guessed Meta assignment. Deduplicate order IDs and keep cancellations and unmatched refunds available for review.
A separate 200-customer payback example
Assume a cohort of 200 new customers, $10,000 assigned acquisition cost and a constant 40% contribution margin on the following cumulative retained revenue. These figures are illustrative assumptions; real contribution must reflect settled costs and refund treatment.
| Observation checkpoint | Cumulative retained revenue | Contribution before acquisition |
|---|---|---|
| First-order checkpoint | 12,000 | 4,800 |
| End of elapsed month 1 | 18,000 | 7,200 |
| End of elapsed month 3 | 27,000 | 10,800 |
Stop wasting ad budget
NovaStorm AI cuts Meta Ads CPA by 30% on average. No complex setup required.
Assigned acquisition cost per new customer is $10,000 ÷ 200 = $50. At the month-1 checkpoint, contribution is $2,800 below acquisition cost; at month 3 it is $800 above. The observed crossing is somewhere after the first checkpoint and by the third, not an exact payment date. Refunds can make the curve fall again. Finer-grained settlements are needed to identify a crossing date and whether payback was sustained.
Coverage and equal-age comparison
- Count unique customers with a valid recorded source divided by all qualifying cohort customers. In the small dataset, January coverage is 1 ÷ 2 = 50%; do not discard the unknown customer and report 100%.
- Compare two cohorts only after the same follow-up age. Mark incomplete months, delayed settlements and right-censored customers rather than filling future cells with zero.
- Use the same acquisition-cost scope: media, allocated creative cost and acquisition labor, if included. Track retention spending separately and deduct it consistently from later contribution.
- Check product mix, geography, offer, return rate and source coverage. A richer cohort may reflect those differences; campaign-specific causal claims require a separate experiment.
The Shopify customer-report documentation explains its own first-order cohort definitions and projection controls. Its configuration is a reference to inspect, not evidence of a NovaStorm Shopify integration or this worksheet being calculated by NovaStorm.
Separate observed and forecast money
Keep completed follow-up in an observed column and model-based future repeat contribution in a forecast column, with assumptions and a downside case. A projected $20 repeat contribution cannot fund today’s invoice. State a cash-payback limit and review date before increasing acquisition exposure; no cohort trajectory guarantees the next one.
Reconcile the source and payment layers with the GA4, Meta and orders reconciliation process, then use the funnel metric definitions to keep customers, orders and credited conversions distinct. NovaStorm campaign planning can use your verified summary as an input; the cohort calculation and forecast are external analytical work.
Published by NovaStorm AI. Planning examples are illustrative assumptions, not measured customer results.
Disclaimer: This article was generated with the assistance of AI and reviewed by the NovaStorm AI team. While we strive for accuracy, we recommend verifying specific data points and consulting official sources (linked where available) for critical business decisions.
Ready to automate your Meta Ads?
NovaStorm AI takes full responsibility for your campaigns — from monitoring to optimization.
Start NowMore on Metrics and reporting
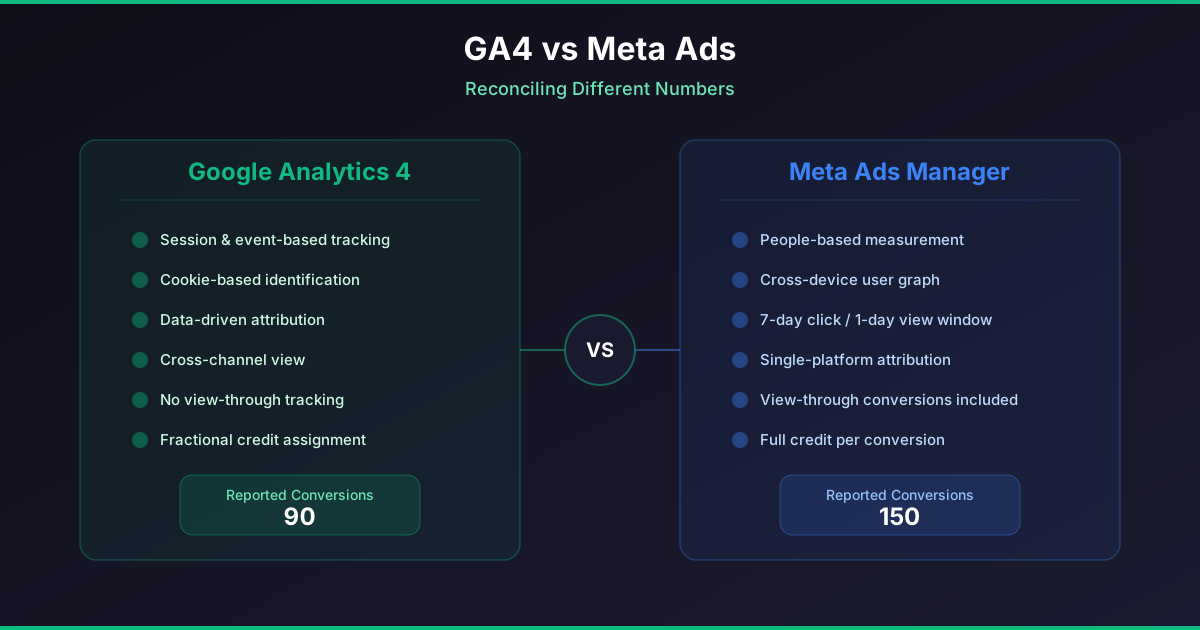
Google Analytics 4 and Meta Ads: Reconciling Different Numbers
Reconcile paid orders, refunds, collected events and channel credit in GA4 and Meta; use scoped local attribution tests and release acceptance checks.

Video Retention Metrics: How to Analyze Watch-Through Rates on Meta
Read video export columns with explicit denominators and replay limits, compare compatible edits and test attention alongside mature purchase cost.
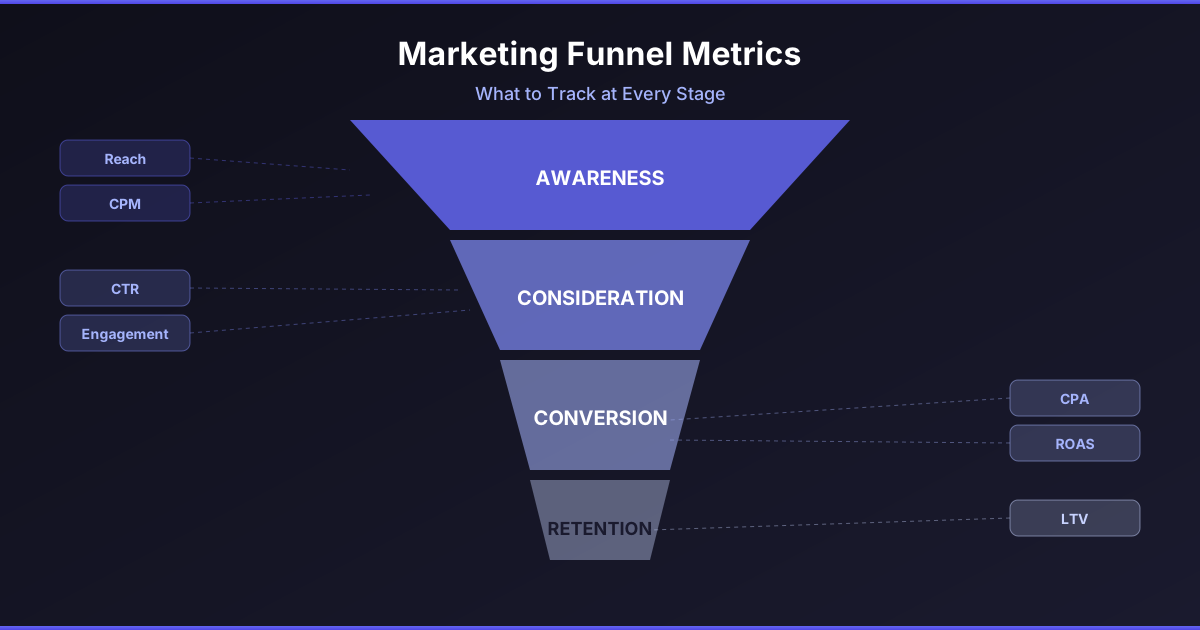
Marketing Funnel Metrics: What to Track at Every Stage
Reconcile campaign totals with session and order records, define mature cohorts and derive an allowable CPA from contribution and a profit reserve.

iOS vs Android Performance Gaps in Meta Ads: Analysis and Strategy
Reconcile delivery-device and payment-device reports, test equivalent mobile checkout paths, and split devices only for a bounded commercial reason.